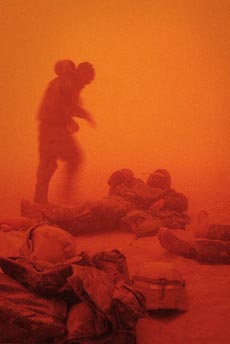
AP Photo
Sandstorm Over Baghdad:
The Dust Storm that Stalled the Coalition Invasion of Iraq
AP
Photo
Author: Carl Drews
Copyright October 2004
Class Project for ATOC 5720: Introduction to Atmospheric Dynamics
University of Colorado at Boulder
Dr. David Noone, Instructor
Abstract:
During Operation Iraqi Freedom in March 2003 a major dust storm swept through Baghdad and across the greater Tigris and Euphrates valleys. The sandstorm severely impacted military operations by reducing visibility and forcing grit into the weapons systems. This paper analyzes the meteorology behind the storm, focusing on the temperature regime in Baghdad during the five days of this event.
Study Domain:
Latitude: 13 North – 53 North
Longitude: 4 East – 84 East
Study Dates:
March 23 - 27, 2003
Baghdad is at 33 degrees 20 minutes north latitude, 44 degrees 25 minutes east longitude.
The Storm
On March 25, 2003 a low-pressure cyclonic storm swept into Iraq, bringing with it sand and dust from the deserts of Saudi Arabia and Egypt. Corporal Zack Brackney was with the 1st Marine Division fighting somewhere south of Baghdad when the sandstorm hit. He remembers that everything slowly turned a yellowish-orange color, with decreasing visibility as the wind gathered strength. His MP company hunkered down as visibility dropped to 10 meters, only moving to conduct defensive patrols around their perimeter. Ochre dust and grit worked its way into every crevice of every weapon, garment, and vehicle. There was a little rain, but “Pretty much all that happened was that we were hit by little balls of mud from the sky for a couple minutes.” The howling winds blew for three days.
Rick Atkinson was a journalist embedded with the 101st Airborne Division during the coalition invasion of Iraq. He writes: “A fierce storm that, like this one, blows out of the south is known as a turab , but everyone in the 101st Airborne Division insisted on calling it a shamal - which is a wind from the north - perhaps because shamal has a plague-of-frogs ring.” The more common term in international circles is a “shamal”, which means “north” in Arabic (Warner).
Synoptic Description
The dust storm that enveloped Baghdad for three days was not unusual. Baghdad lies in the center of Iraq along the Tigris river. To the south of Iraq is the great Arabian desert, a source of heat and dust. The Mediterranean Ocean lies to the west, a source of moisture and moderate temperatures. Figure 1 below shows Iraq and Baghdad on March 26, 2003.
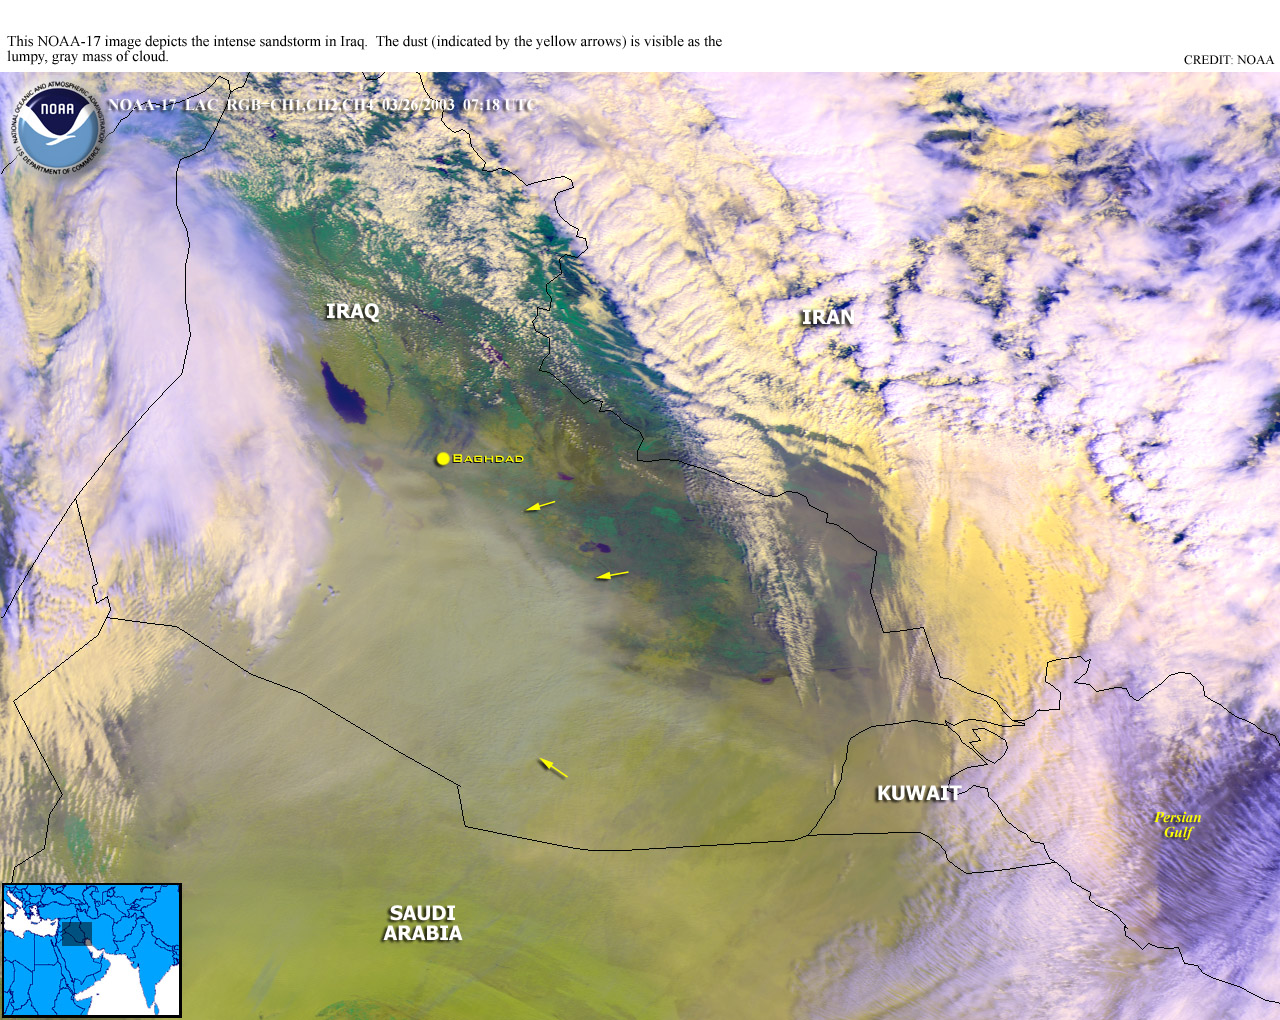
Figure 1. Iraq and Baghdad (NOAA).
This particular storm was a mid-latitude cyclonic system that happened to coalesce into a well-organized Low just as the Marines were approaching Baghdad, and as the Iraqi Republican Guard were preparing their defense of the city. Figure 2 shows the Middle East on March 24 at 12Z (GMT).
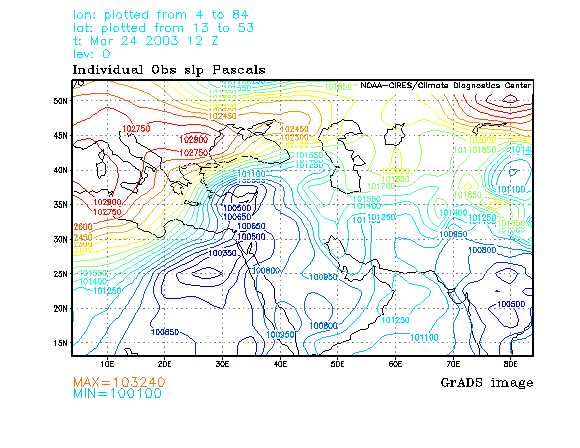
Figure 2. Sea-Level Pressure Map on March 24 (NCEP).
The most intense period of the sandstorm occurred on March 25. Figure 3 below shows a circular system of low pressure centered over western Iraq. Note the closely-spaced isobar lines directly over Baghdad itself. This pressure gradient, combined with the Coriolis force, suggests that strong southerly winds were buffeting the city.
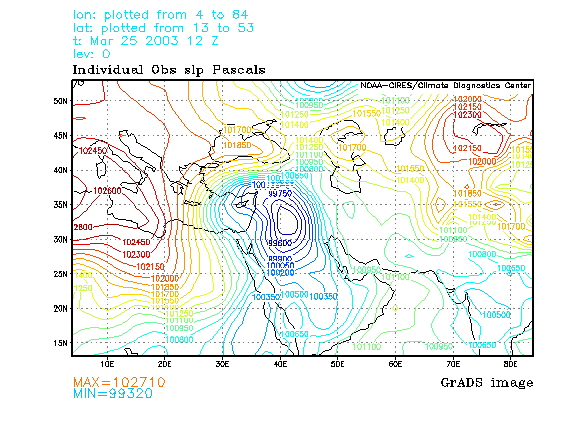
Figure
3. Sea-level Pressure Map on March 25 (NCEP).
The storm track originated in northern Africa moving in an easterly direction, proceeded north through Saudi Arabia and Iraq, then gradually dissipated to the northeast. This track followed the typical synoptic sequence of a shamal (Perrone 1979). Figure 4 shows the weather situation on March 26.
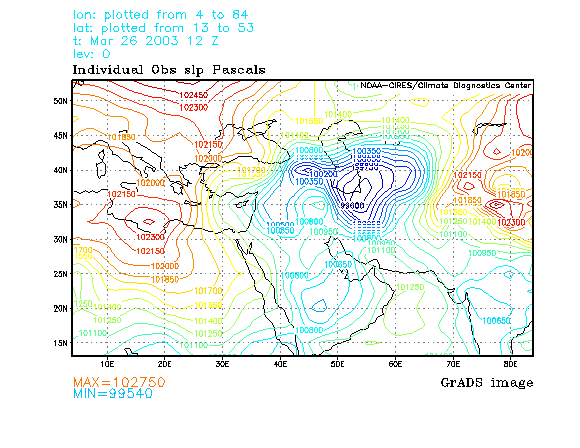
Figure 4. Sea-level Pressure Map on March 26 (NCEP).
Figure 5 below provides another view on the morning of March 26. This image from the SeaWiFS Project, NASA/Goddard Space Flight Center, clearly shows the counter-clockwise swirl of clouds as the cyclone passed over Iraq, and dust being transported within the warm sector of the system.
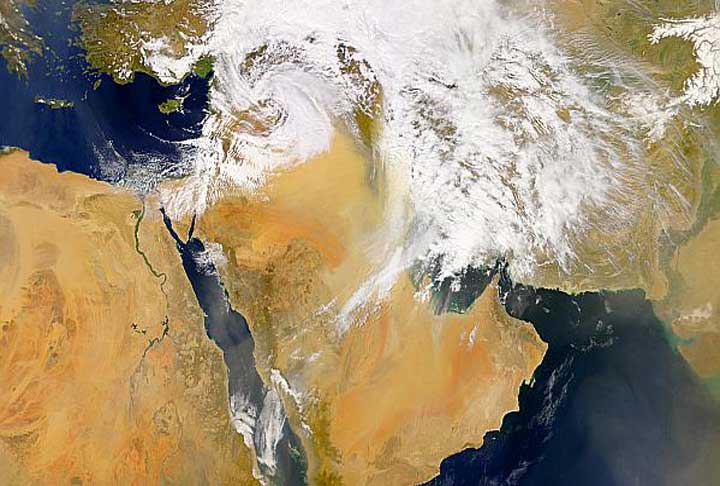
Figure 5. Low Pressure System over the Middle East on March 26 (NASA/Goddard).
Temperature Profile
To understand the dynamics of the turab and shamal better, we can consider a number of meteorological variables collected at Baghdad during the 5-day period of March 23-27, 2003. These variables can be retrieved from the NCEP/NCAR Reanalysis web site at http://www.cdc.noaa.gov/cdc/data.ncep.reanalysis.html. Figure 6 below shows the temperature, pressure, thickness, and wind for Baghdad during the study period at 6-hour intervals.
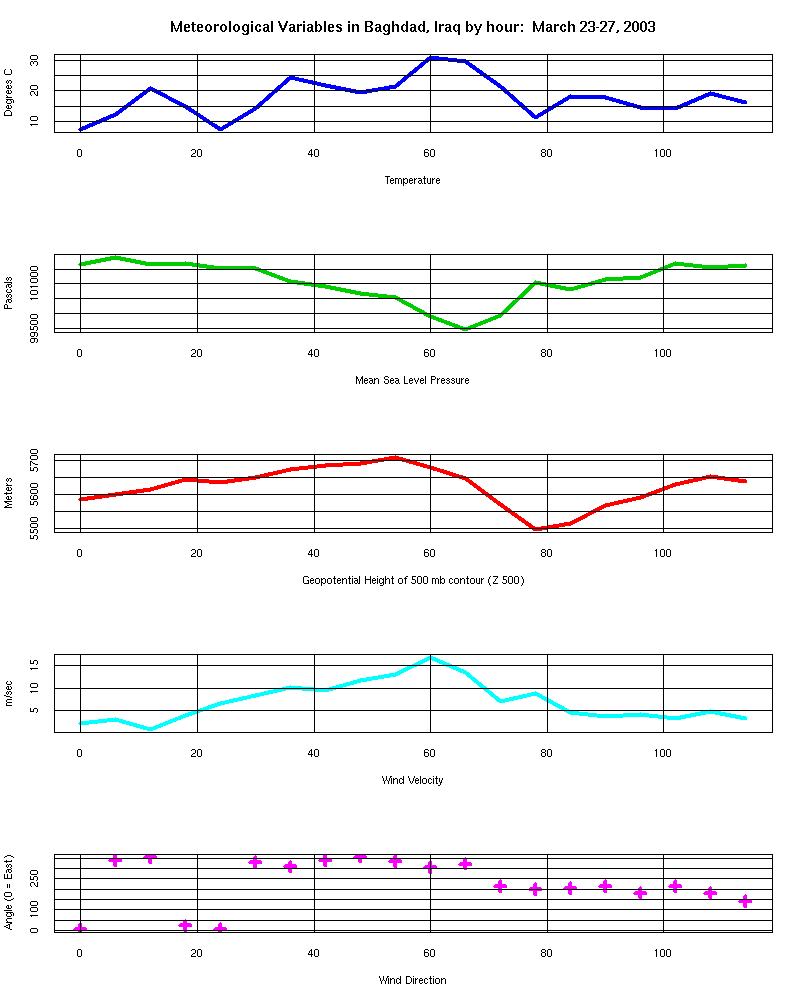
Figure 6. Meteorological Data at Baghdad.
The temperature history of Baghdad during the turab of March 25, 2003 reveals a diurnal cycle of solar heating superimposed over the passage of fronts associated with the low-pressure system. There are five peaks in temperature on the graph, corresponding to the 12Z hours of the five study days. The hottest temperature occurred at 12Z on March 25 (hour 60), when the fierce winds of the turab brought hot air advection from the south into the city and surrounding areas. Hour 60 also represents the peak wind velocity, with winds blowing in from angle 307 degrees (south south-east). Recall from Figure 3 that these strong winds correspond to the closely-spaced isobars on the east side of the Low.
The wind abruptly changed direction on March 26, now coming from the west south-west. This change marks the passage of the cyclone's cold front through the area, as displayed by a drop in temperature at the same time. The sea level pressure began to rise again on March 26. The upper-air height chart shows that the 500 mb Low lagged the surface Low by about 12 hours, but it also moved out of the area to the northeast.
Dynamics of the Sandstorm
We may calculate the Rossby number of the low-pressure system that passed through Iraq in order to determine the scale of these meteorological events.
R = U / f L
R is the dimensionless Rossby number, U is the fluid velocity scale, f is the Coriolis parameter, and L is the scale of the fluid motion. The Coriolis parameter depends on the rotation omega of the earth, and the latitude phi of Baghdad.
f = 2 omega sin(phi)
f = 2 * 2pi sin(33) / (60 * 60 * 24) = 7.92e-5/sec
So the scale of the Coriolis parameter f is e-4/sec. The peak wind speed was about 17 meters/sec, or U = 17 m/sec. Using Figure 3 we can estimate that the radius of the low-pressure swirl is about the same as the width of the Caspian Sea, or 400 km. Therefore L = 4e5 meters. So the Rossby number here is:
R = 17 / (e-4 * 4e5) = 0.4
From this value we know that geostrophic winds along the isobars will dominate, rather than cyclostrophic winds (Fleagle and Businger). We should also be able to calculate the speed of the geostrophic wind aloft on March 25, using values from the geopotential chart shown in Figure 7 below.
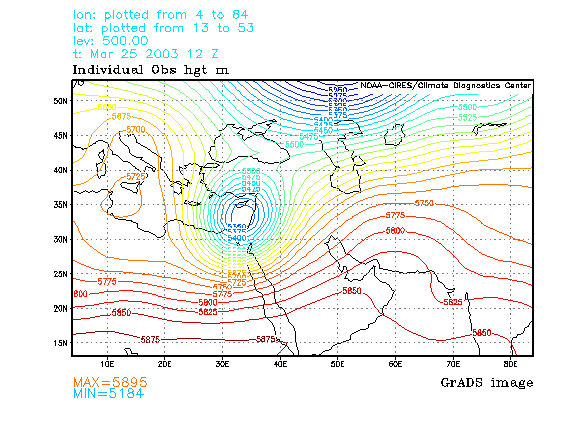
Figure 7. Geopotential at 500mb on March 25 (NCEP).
The velocity of the geostrophic wind is given by the equation:
Vg = -partial(geopotential) / partial(n) * 1/f
The most closely-spaced lines appear to be over Egypt. Reading from Figure 7 we can roughly estimate along a north-south section that
partial(geopotential) = (5400 – 5650 m) * 9.8 m/sec2 = -2450 m2/sec2
partial(distance) = 500 km, or 5e5 meters
Therefore we can calculate an estimate for the geostrophic west wind speed over Egypt:
Vg = 2450 / (5e5 * e-4) = 50 meters per second
This result matches the observation that high-level geostrophic winds are usually stronger than surface winds. A shear between upper-level and lower-level winds tends to amplify the effects of low-level convection, thereby increasing the power of the storm.
Military Consequences
Blowing sand and dust impaired military operations by reducing visibility and penetrating into the mechanical parts of weapons systems. Zack Brackney explained that the M16 rifle is a precision weapon and does not function well in gritty conditions. He and his Marine company used pump shotguns or captured AK-47s instead while on patrol during the sandstorm. They had anticipated problems with dust.
The turab came screaming into the Baghdad area from the southeast, at the backs of the advancing coalition forces. Even behind goggles and windshields, a tailwind is a distinct psychological advantage. That same wind blew into the faces of the Iraqi defenders, offsetting any advantage they might have had through greater local experience with similar dust storms.
While Corporal Brackney and his Marines were fumbling with personal tasks in the storm, General Tommy Franks and his staff were pondering how to use the foul weather to their advantage. Figure 8 shows a time-height section of forecast dust at Baghdad (Comet).
Figure
8. Time-Height Section of Dust at Baghdad (NAAPS).
Although his helicopters were gounded, General Franks realized that the Air Force could fly above the dust cloud and attack the now-stationary Republican Guard with guided bombs that were impervious to blowing dust. “That night [March 25] B-52s, B-1s and a whole range of fighter-bombers flew above the dense ochre dome of the sandstorm, delivering precision-guided bombs through the zero-visibility, zero-ceiling weather. ... The bombardment, which lasted from the night of March 25 to the morning of March 27, was one of the fiercest and most effective in the history of warfare.” (Franks)
The Air Force did their devastating work. There was no titanic battle with the Republican Guard after all, and the Americans soon captured Baghdad after a series of armed incursions. The statue of Saddam Hussein in Firdos Square was toppled on April 9.
References
Rick Atkinson, book “In the Company of Soldiers”, 2004.
Zack Brackney, Corporal in Military Police company, Headquarters & Service Battalion, First Marine Division. Personal communication, September 2004.
Comet (UCAR), web page “Forecasting Dust Storms” http://meted.ucar.edu/mesoprim/dust/print.htm.
Robert Fleagle and Joost Businger, book “An Introduction to Atmospheric Physics”, 1980, page 164.
General Tommy Franks, United States Army, memoirs posted online at:
http://normblog.typepad.com/normblog/2004/08/dust_storm.html
http://www.timesonline.co.uk/newspaper/0,,176-1197265,00.html
NCEP Reanalysis data provided by the NOAA-CIRES Climate Diagnostics Center, Boulder, Colorado, USA, from their Web site at http://www.cdc.noaa.gov/.
Thomas J. Perrone, technical report “Winter Shamal in the Persian Gulf”, Naval Environmental Prediction Research Facility, Monterey, California, August 1979.
Dr. Thomas Warner, book “Desert Meteorology”, 2004, p. 149. Personal communication at University Corporation for Atmospheric Research, Boulder, Colorado, September 2004.
This page accessed
(EasyCounter)
times since November 16, 2004.