Kelvin
waves near the tropical tropopause observed in GPS data
Kelvin
waves are eastward traveling, planetary scale waves
trapped near the
equator, evident in atmospheric temperature, pressure and wind fields
(and also
in the ocean).
They contribute a substantial component of temperature variability
near the tropical
tropopause. Kelvin waves are important for influencing the
dehydration of air
entering the stratosphere, and also for the formation of tropical
cirrus clouds. We have used high vertical resolution
GPS radio occultation
temperature measurements to study the detailed structure and
variability of
Kelvin
waves.
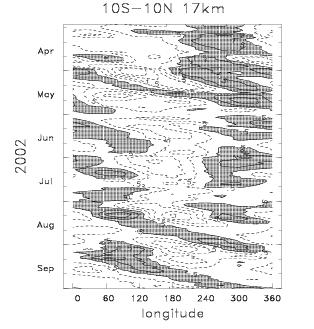
This plot shows a longitude-time section of temperature anomalies at 17
km
during April - September 2002, derived from CHAMP and SAC-C GPS
temperature measurements. Contours are +/- 0.5, 1.5, 2.5,
...K. The
eastward traveling features in May
and August-September are
planetary-scale
Kelvin waves.
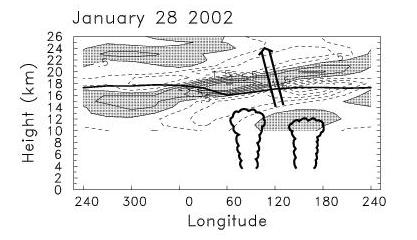
Here's an example of a
large-amplitude Kelvin wave on Jan.
28, 2002.
Contours (+/- 0.5, 1.5, 2.5, ...K) show
temperature anomalies (deviations from zonal
average) of equatorial (10 N - 10 S) temperatures. The
eastward phase tilt with height
is characteristic of an upward propagating Kelvin wave (with a vertical
wavelength
of ~8 km for this
case). The heavy line
is the cold point tropopause. This
Kelvin
wave event was observed in association with
enhanced deep convection occurring
over Indonesia, as derived from outgoing longwave
radiation (OLR) observations
(indicated by the schematic clouds). The
vertical arrow denotes the Kelvin wave
group velocity.
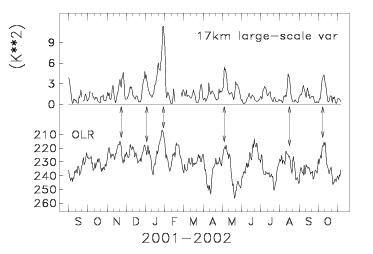
Correlations with OLR data show
that the Kelvin waves are forced by variations
in deep convection.
The upper time series shows the tropical temperature
variance at 17 km, with peaks corresponding to large amplitude Kelvin
waves
(the large peak in January corresponds to the event in the previous
figure).
The lower time series is OLR over the Indonesian region; peaks
correspond to
enhanced deep convection (note the inverted scale). The arrows
highlight
maxima in Kelvin waves that are correlated with variations in
convection.
For more details on the links with deep convection,
plus coupling of the Kelvin
waves with the stratospheric wind field (in particular,
the QBO), see our paper:
Randel, W.J., and F. Wu, 2005: Kelvin wave variability near the
equatorial
tropopause observed in GPS radio occultation measurements. J. Geophys.
Res.,
Vol. 110, No. D3, D03102,
doi10.1029/2004JD005006. Here's
a pdf reprint.
Back to Bill's home page