Comparing decadal changes in stratospheric
water vapor derived from:
* Boulder balloon measurements (1980-2003)
* HALOE satellite data (1991-2003)
A long-term record of stratospheric water vapor has been obtained by
balloon-borne
frost point hygrometer measurements over Boulder, Colorado,
starting in 1980. These data (with measurements approximately
once per month)
show an intriguing long-term increase of ~ 1%/year. Here's an
updated time series
of the Boulder data, averaged over the altitude range 17-22 km.
These are from
a revised version of the data set, provided by Holger Voemel. The
light line is
a smooth fit to the individual points, using a running Gaussian average
(with
half-width of 3 months):
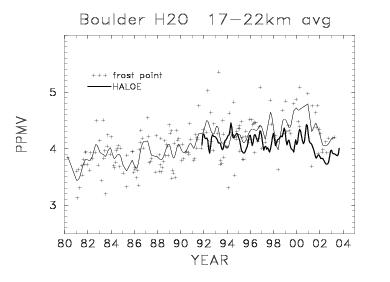
The HALOE satellite instrument has been making global measurements of
stratospheric water vapor since late 1991. The dark line in the
above
figure
shows the HALOE data during 1991-2003, for the same 17-22 km altitude
region, averaged over for longitudes 80-130 degrees west, near Boulder.
While there is good agreement for the early part of the overlap
(~1992-1996),
there is some disagreement after 1997, when the Boulder data show
persistently higher values than the HALOE record. The
result is that the
Boulder data show a net increase for 1992-2002, while HALOE data do not.
This is quantified in the trends calculated from both data sets for the
identical
period 1992-2002:
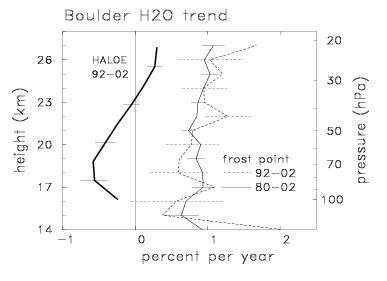
Thus, decadal changes calculated from the Boulder balloon and HALOE
data sets
for the same time period (1992-2002) and location show very different
results.
At present we don't have an explanation for this result. However,
it will be important
to resolve these differences, because these are the two best (and
only!) continuous
records of stratospheric water vapor covering more than a decade.
Back to Bill Randels' home page