Tilmes, S., J.-F. Lamarque, L. K. Emmons, A. Conley, M. G. Schultz, M. Saunois, V. Thouret, A. M. Thompson, S. J. Oltmans, B. Johnson, and D. Tarasick (2011): Technical Note: Ozonesonde climatology between 1995 and 2011: Description, Evaluation and Applications, Atmos. Chem. Phys., 12, 7475-7497, 2012, doi:10.5194/acp-12-7475-2012
|
|
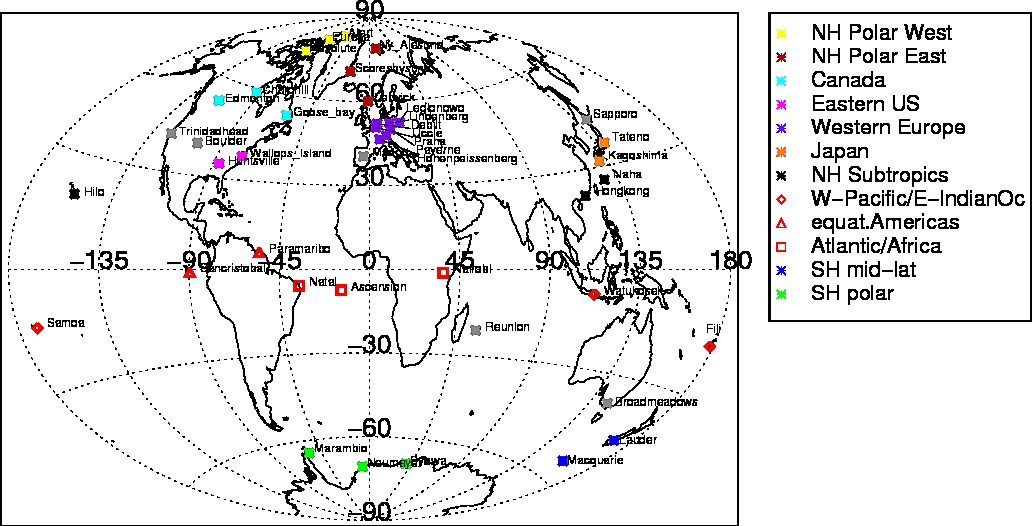
For each station and region we provide monthly averaged ozone profiles between 1000 and 10 hpa (in partial pressure and mixing ratios) averaged over available years between 1995 and 2011, as well as for the years between 1980 and 1993 (for comparisons with the Logan 1999 climatology). Comparisons between the 1980 -- 1993 and the climatology derived by Logan (1999) show a good agreement between the two data sets. Besides averaged profiles (mean and median), we provide information about the standard deviation, the half-width of the distribution (calculated as (75th percentile – 25th percentile)/2), and the number of profiles entering the average, on pressure coordinates at 26 pressure levels between 1000 hPa and 10 hPa. In addition, we provide ozone profiles in tropopause-referenced altitude (km) and altitude (km) coordinates for the period between 1995 and 2011 for each station and region. For tropopause-referenced altitudes, we use the thermal tropopause height (WMO1957) using temperature information from each sounding profile.
In addition, we provide seasonal averaged ozone timelines between 1995 and 2011, seasons are DJF, MAM, JJA, SON. We provide ozone median information for each year, the half-width of the distribution, and the number of profiles entering the distribution for 26 pressure levels between 1000 hPa and 10 hPa. For model evaluation studies we recommend to interpolate the model output to the ozonesonde sites considered in each region and thereafter regionally-aggregated ozone distributions. This leads to a valid comparison to the regionally-aggregated ozone frequency distribution from observations. A model comparison using regional averages can result in misleading results.
Please contact Simone Tilmes in case of questions, comments, or suggestions.