This paper describes some unfunded research that I conducted during 2006-2007. The ACE (Accumulated Cyclone Energy) hurricane index is a product of three factors that can reveal the changing character of hurricane activity.
Click to access a directory of hurricane tracks. Each track is a .kml file suitable for viewing with Google Earth. The height of the track above the earth's surface is proportional to the maximum wind speed squared. I have provided uncompressed files for the period 1990-2006; cyclone tracks back to 1851 are available in the compressed tar archive.
Click to access a directory of hurricane envelopes. Each csv file contains comma-separated-values suitable for importing into a spreadsheet. The height of the envelope is the maximum wind speed squared. I have provided uncompressed files for the period 1990-2006; cyclone envelopes back to 1851 are available in the compressed tar archive.
Click to access a directory containing the calculated ACE indexes by ocean basin. ACE = Accumulated Cyclone Energy index, expressed here in knot2-days. Each file contains comma-separated-values, with column titles. N refers to the power by which the maximum wind speed is raised (2 = squared, for the ACE index). 11YearAverage is a running average that shortens at the end of the dataset. AvgDuration is expressed in units of days. AvgWindN may be thought of as the average intensity, measured in knots-squared.
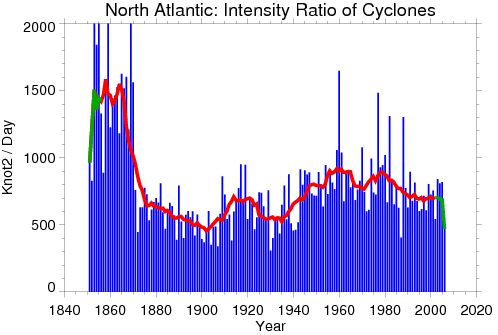
Another interesting metric to calculate is the storm's intensity ratio, defined as the average intensity (knots-squared) divided by the duration (days):
Hurricane intensity ratio = average intensity / durationThe average intensity ratio for tropical cyclones in the North Atlantic is graphed below. Note that the intensity ratios during the period 1850-1870 are artificially high because of incomplete tracks; many of these records contain only a few measurements of the storm at its peak intensity. The erroneously short duration of these hurricanes causes their intensity ratio to become inflated.
The original data was obtained from "best tracks" archives at the National Hurricane Center and the Joint Typhoon Warning Center. Processed files were downloaded from Carl J. Schreck's web site. Please give me credit for any processed data you use from my web site. Thanks!
Return to Carl Drews at NCAR.
Last update: July 27, 2010