
Dr. Lesley L. Smith, Associate Scientist
Plots
Plots for possible HIRDLSv7 contribution to SPARC DI
New Level 3 plots for V7 DQD
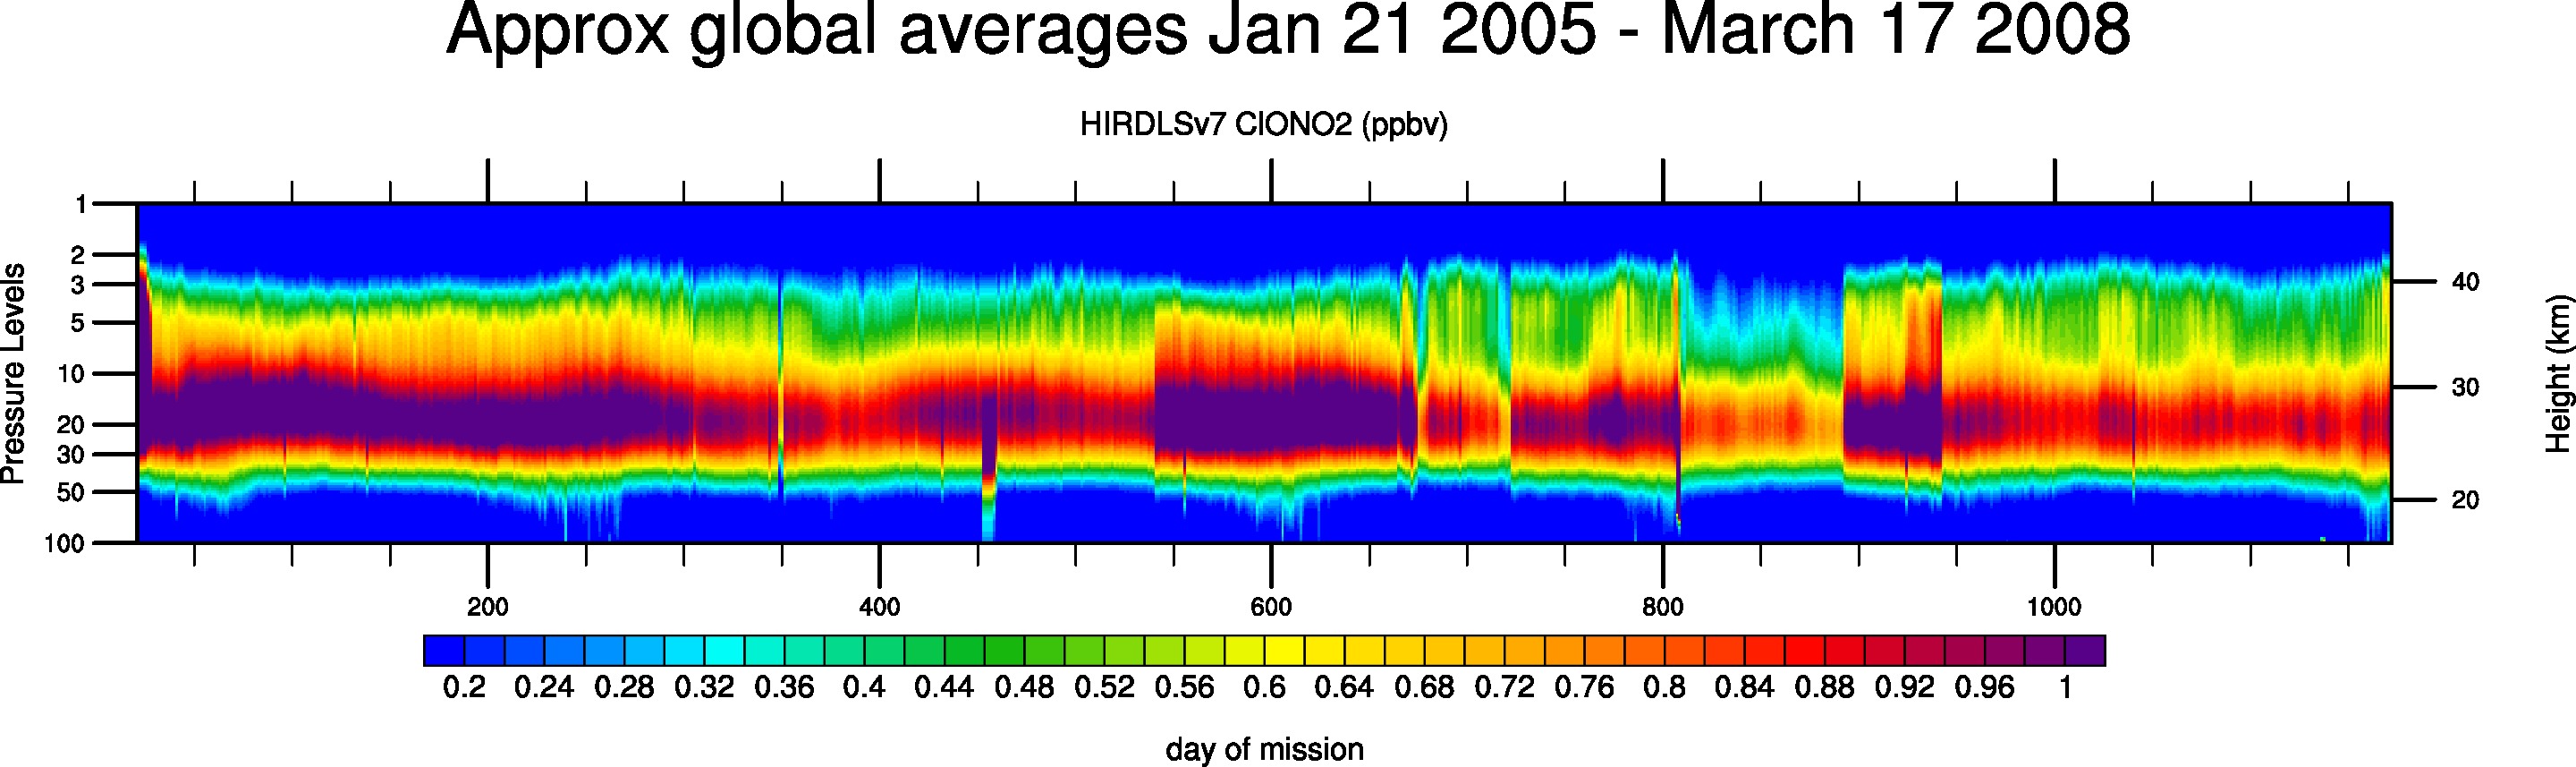
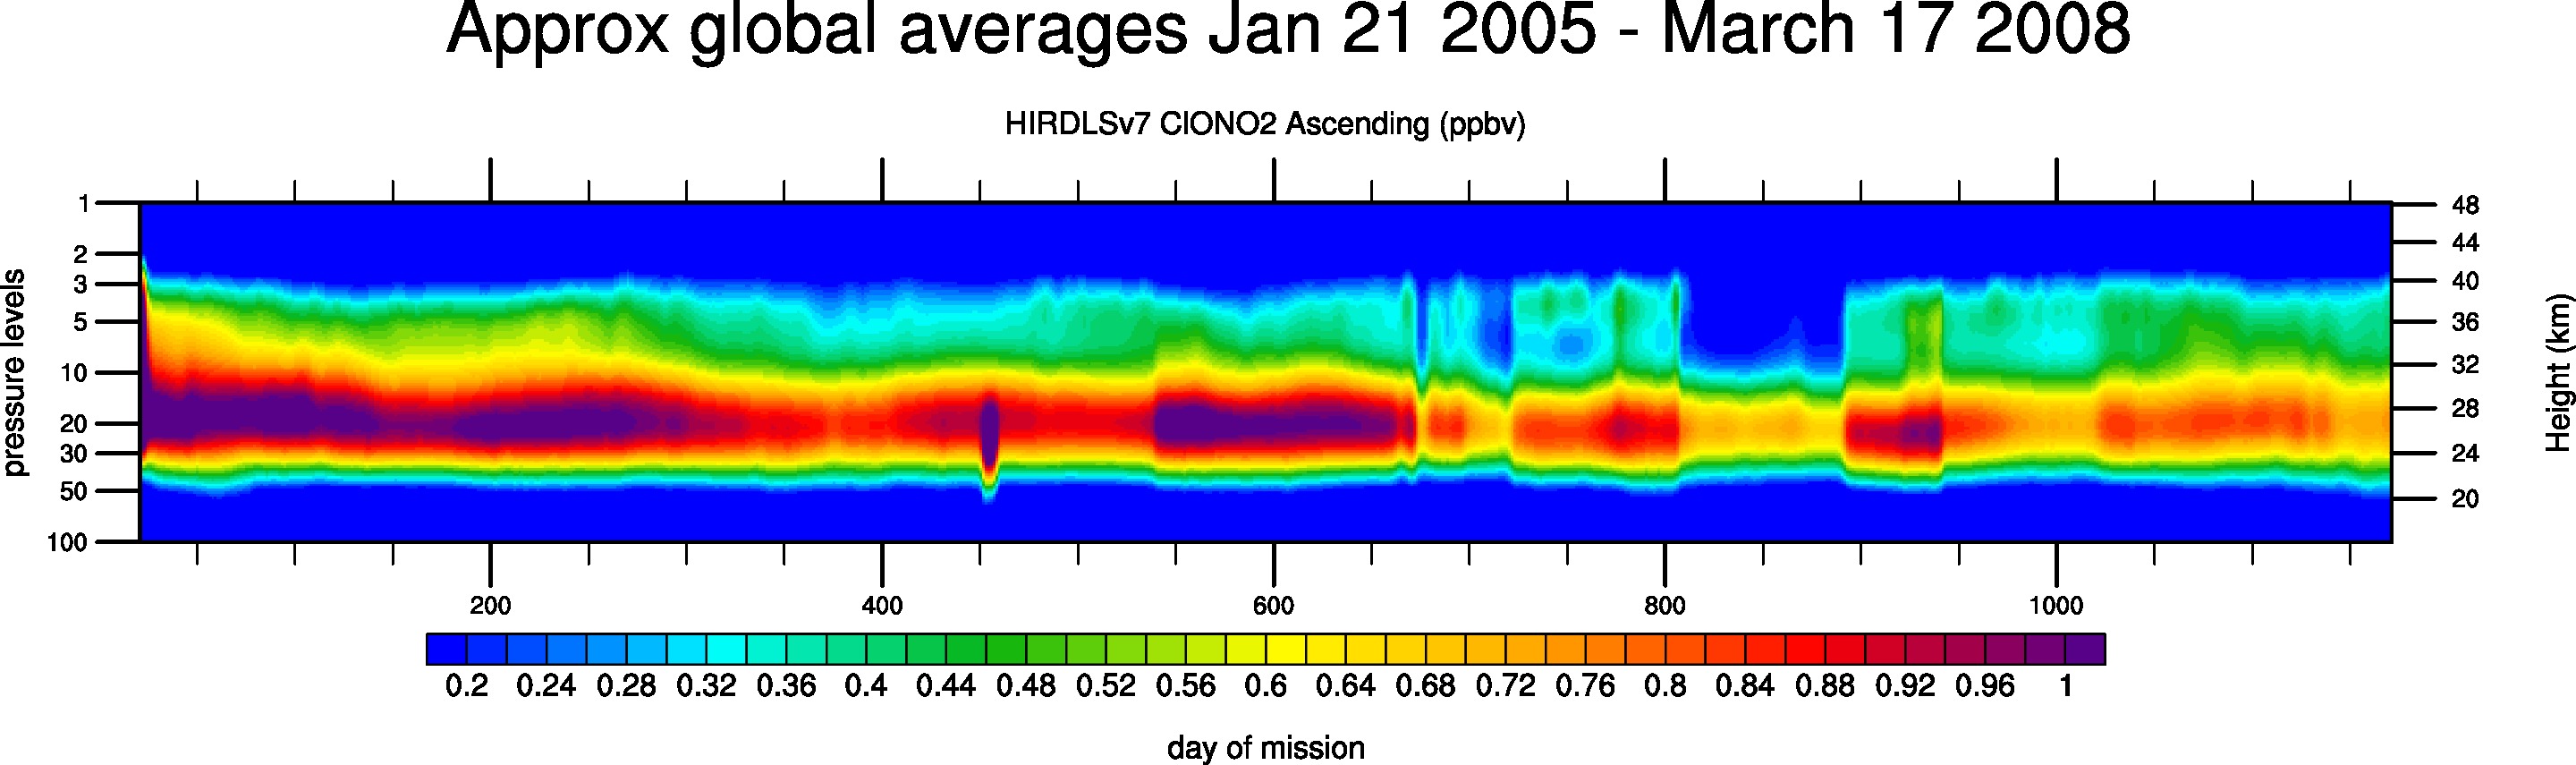
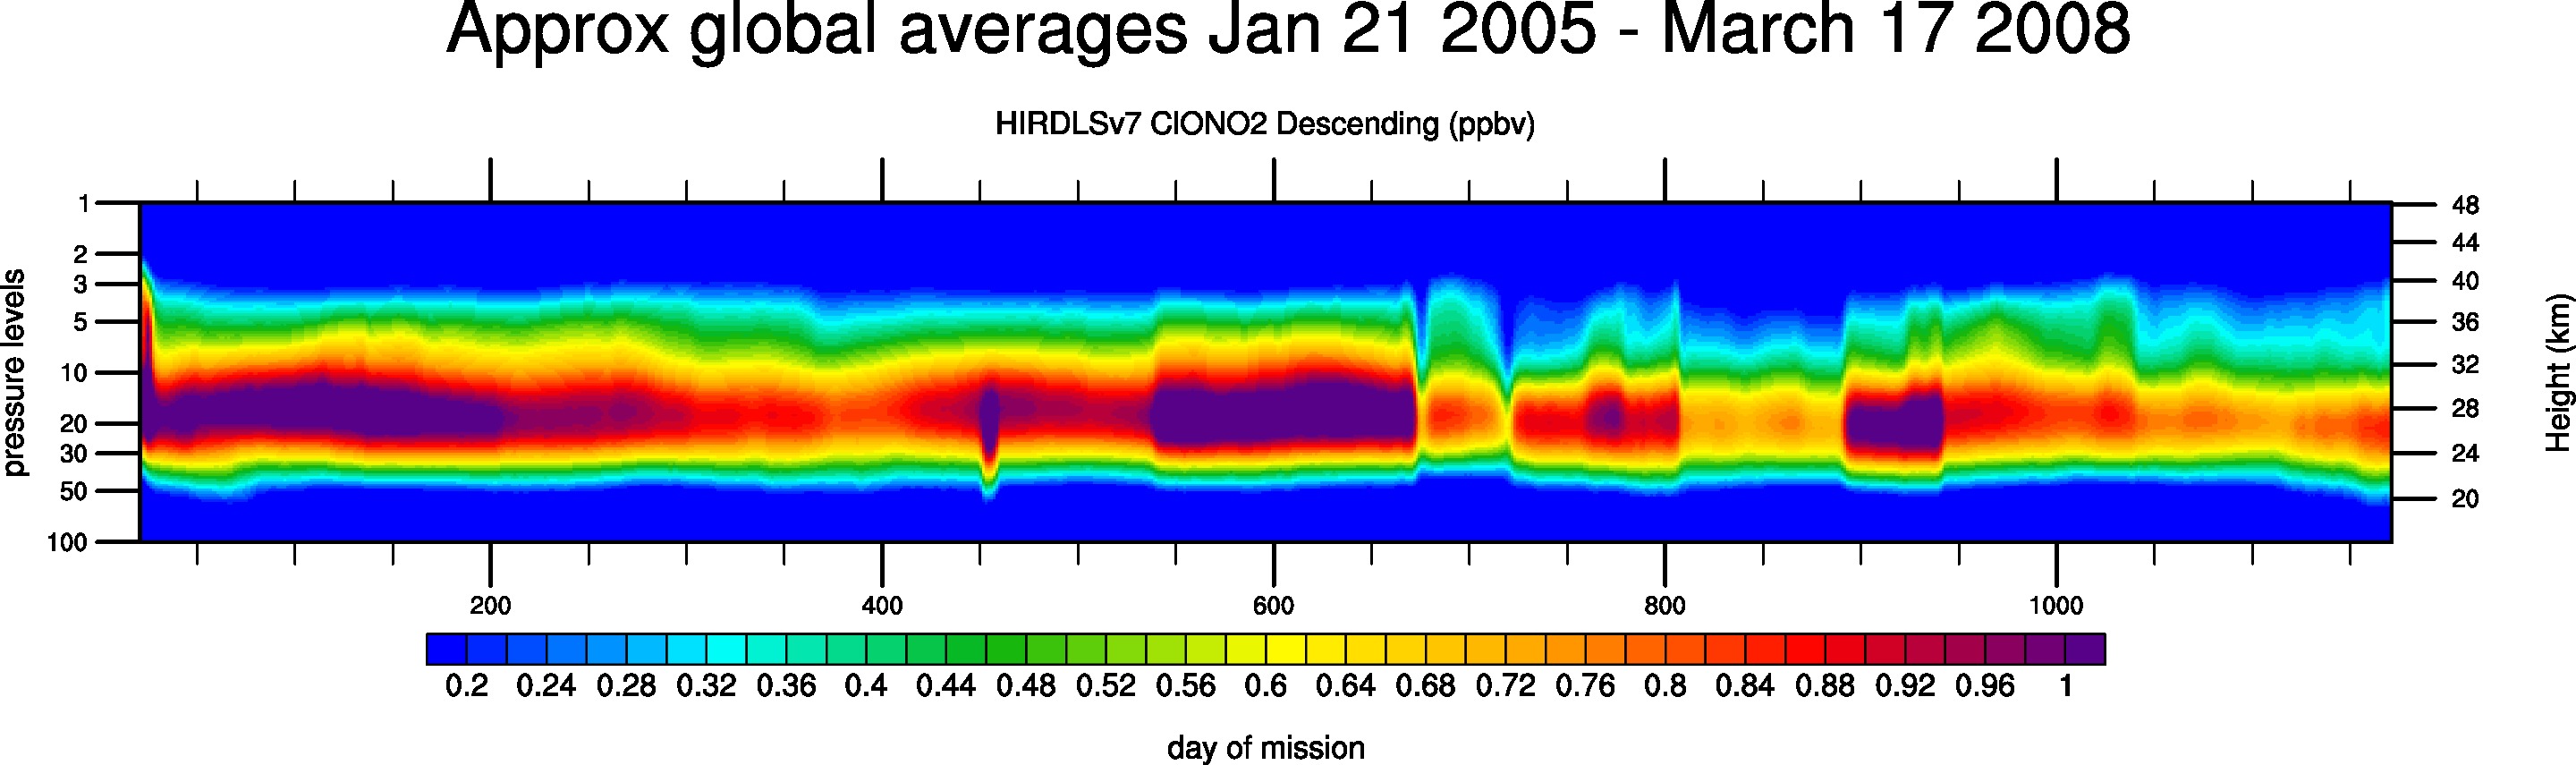
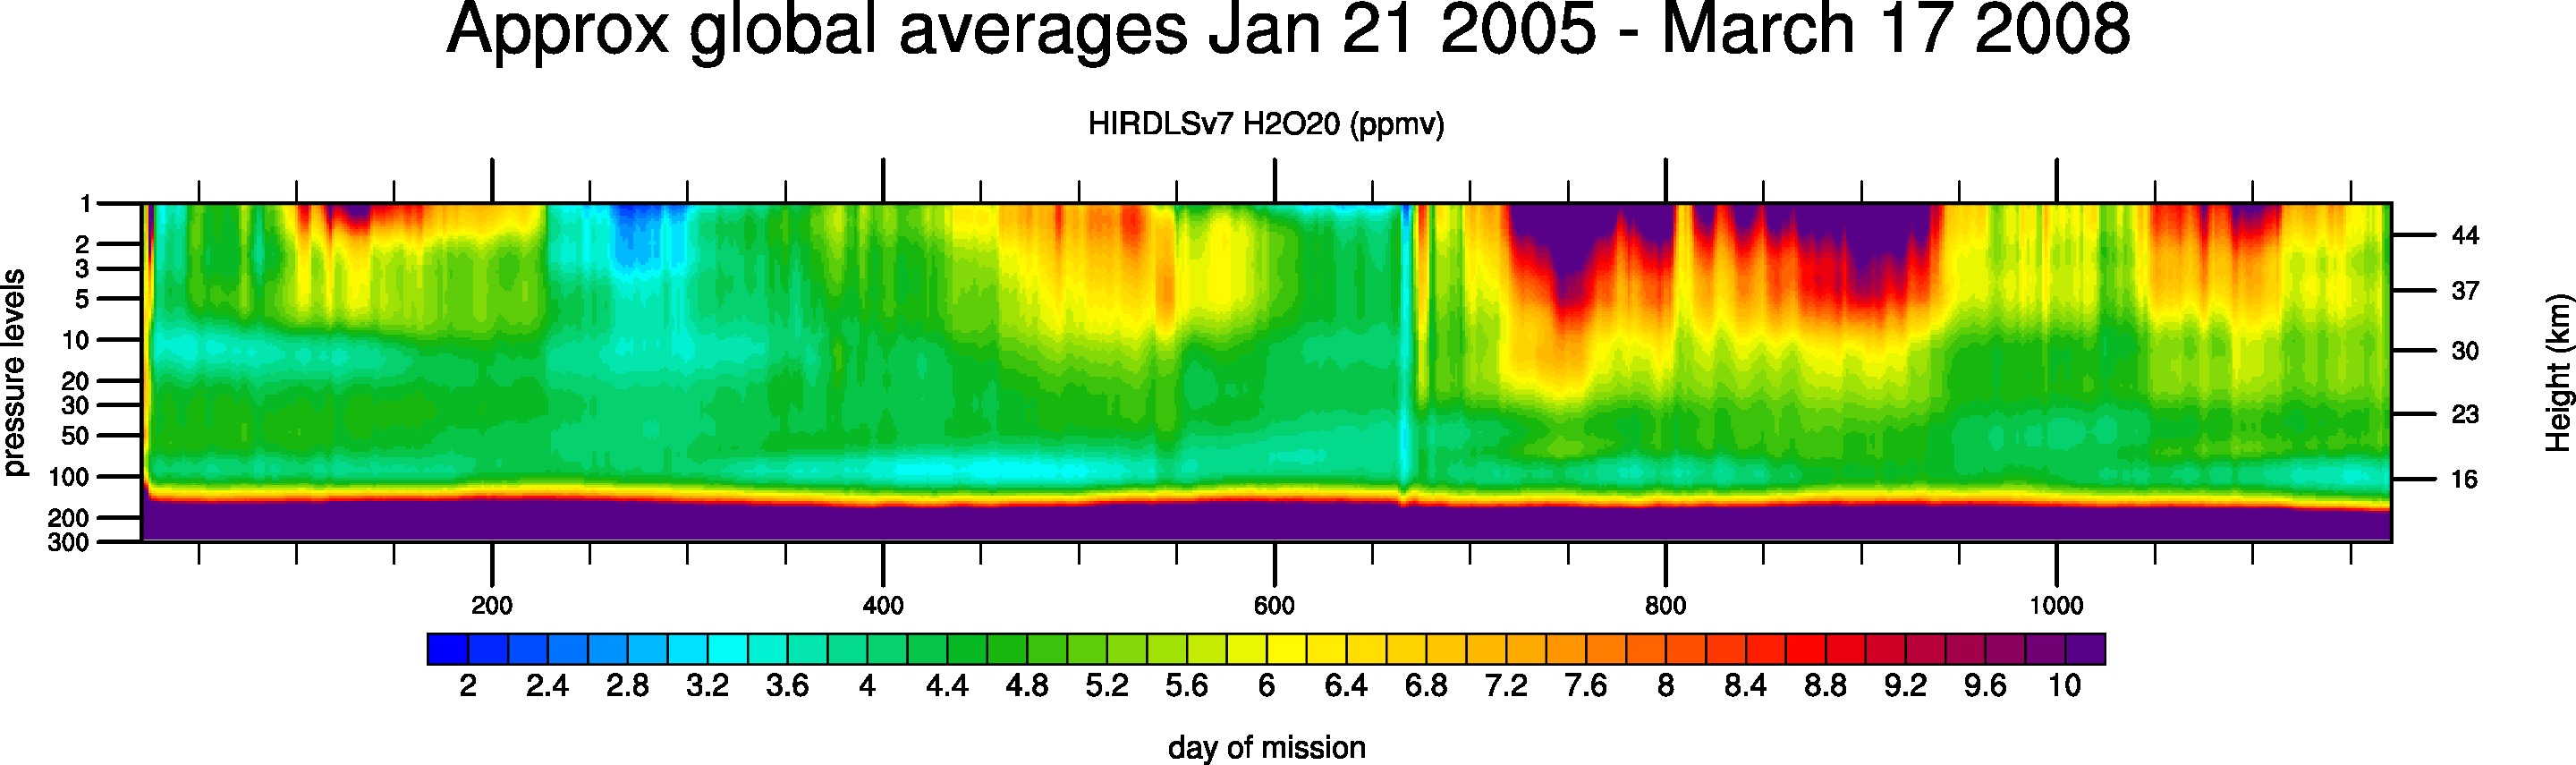
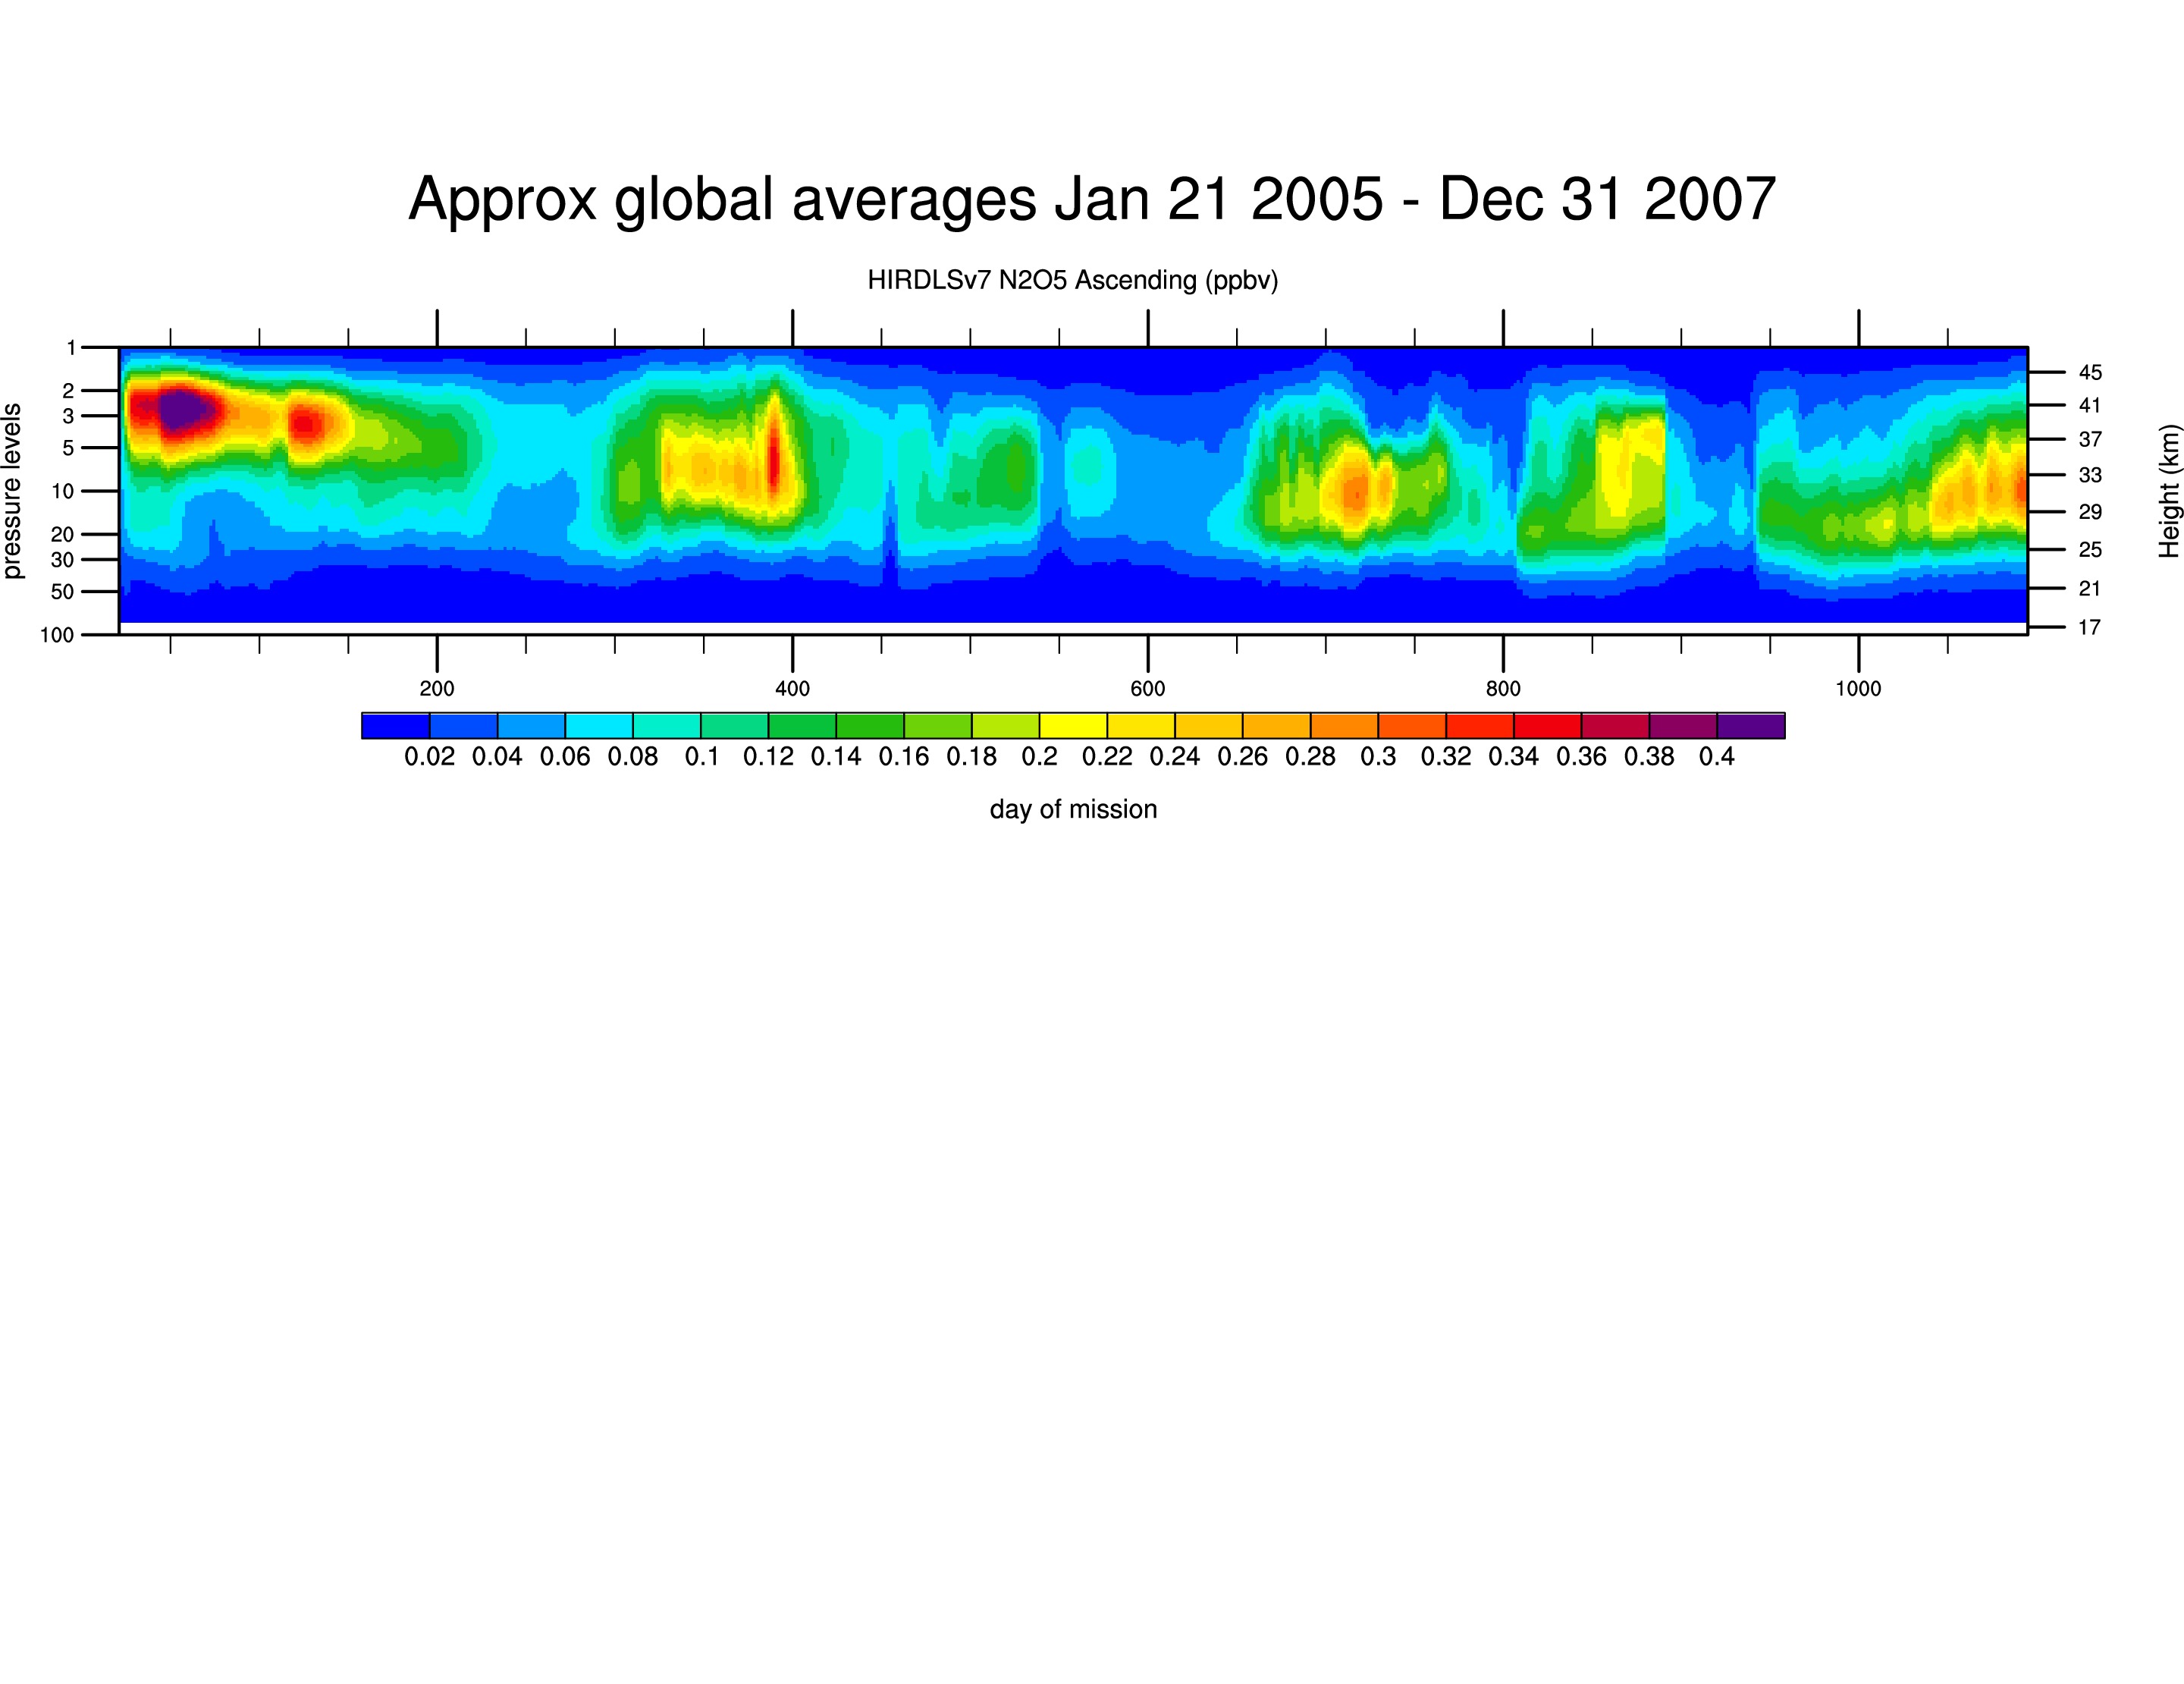
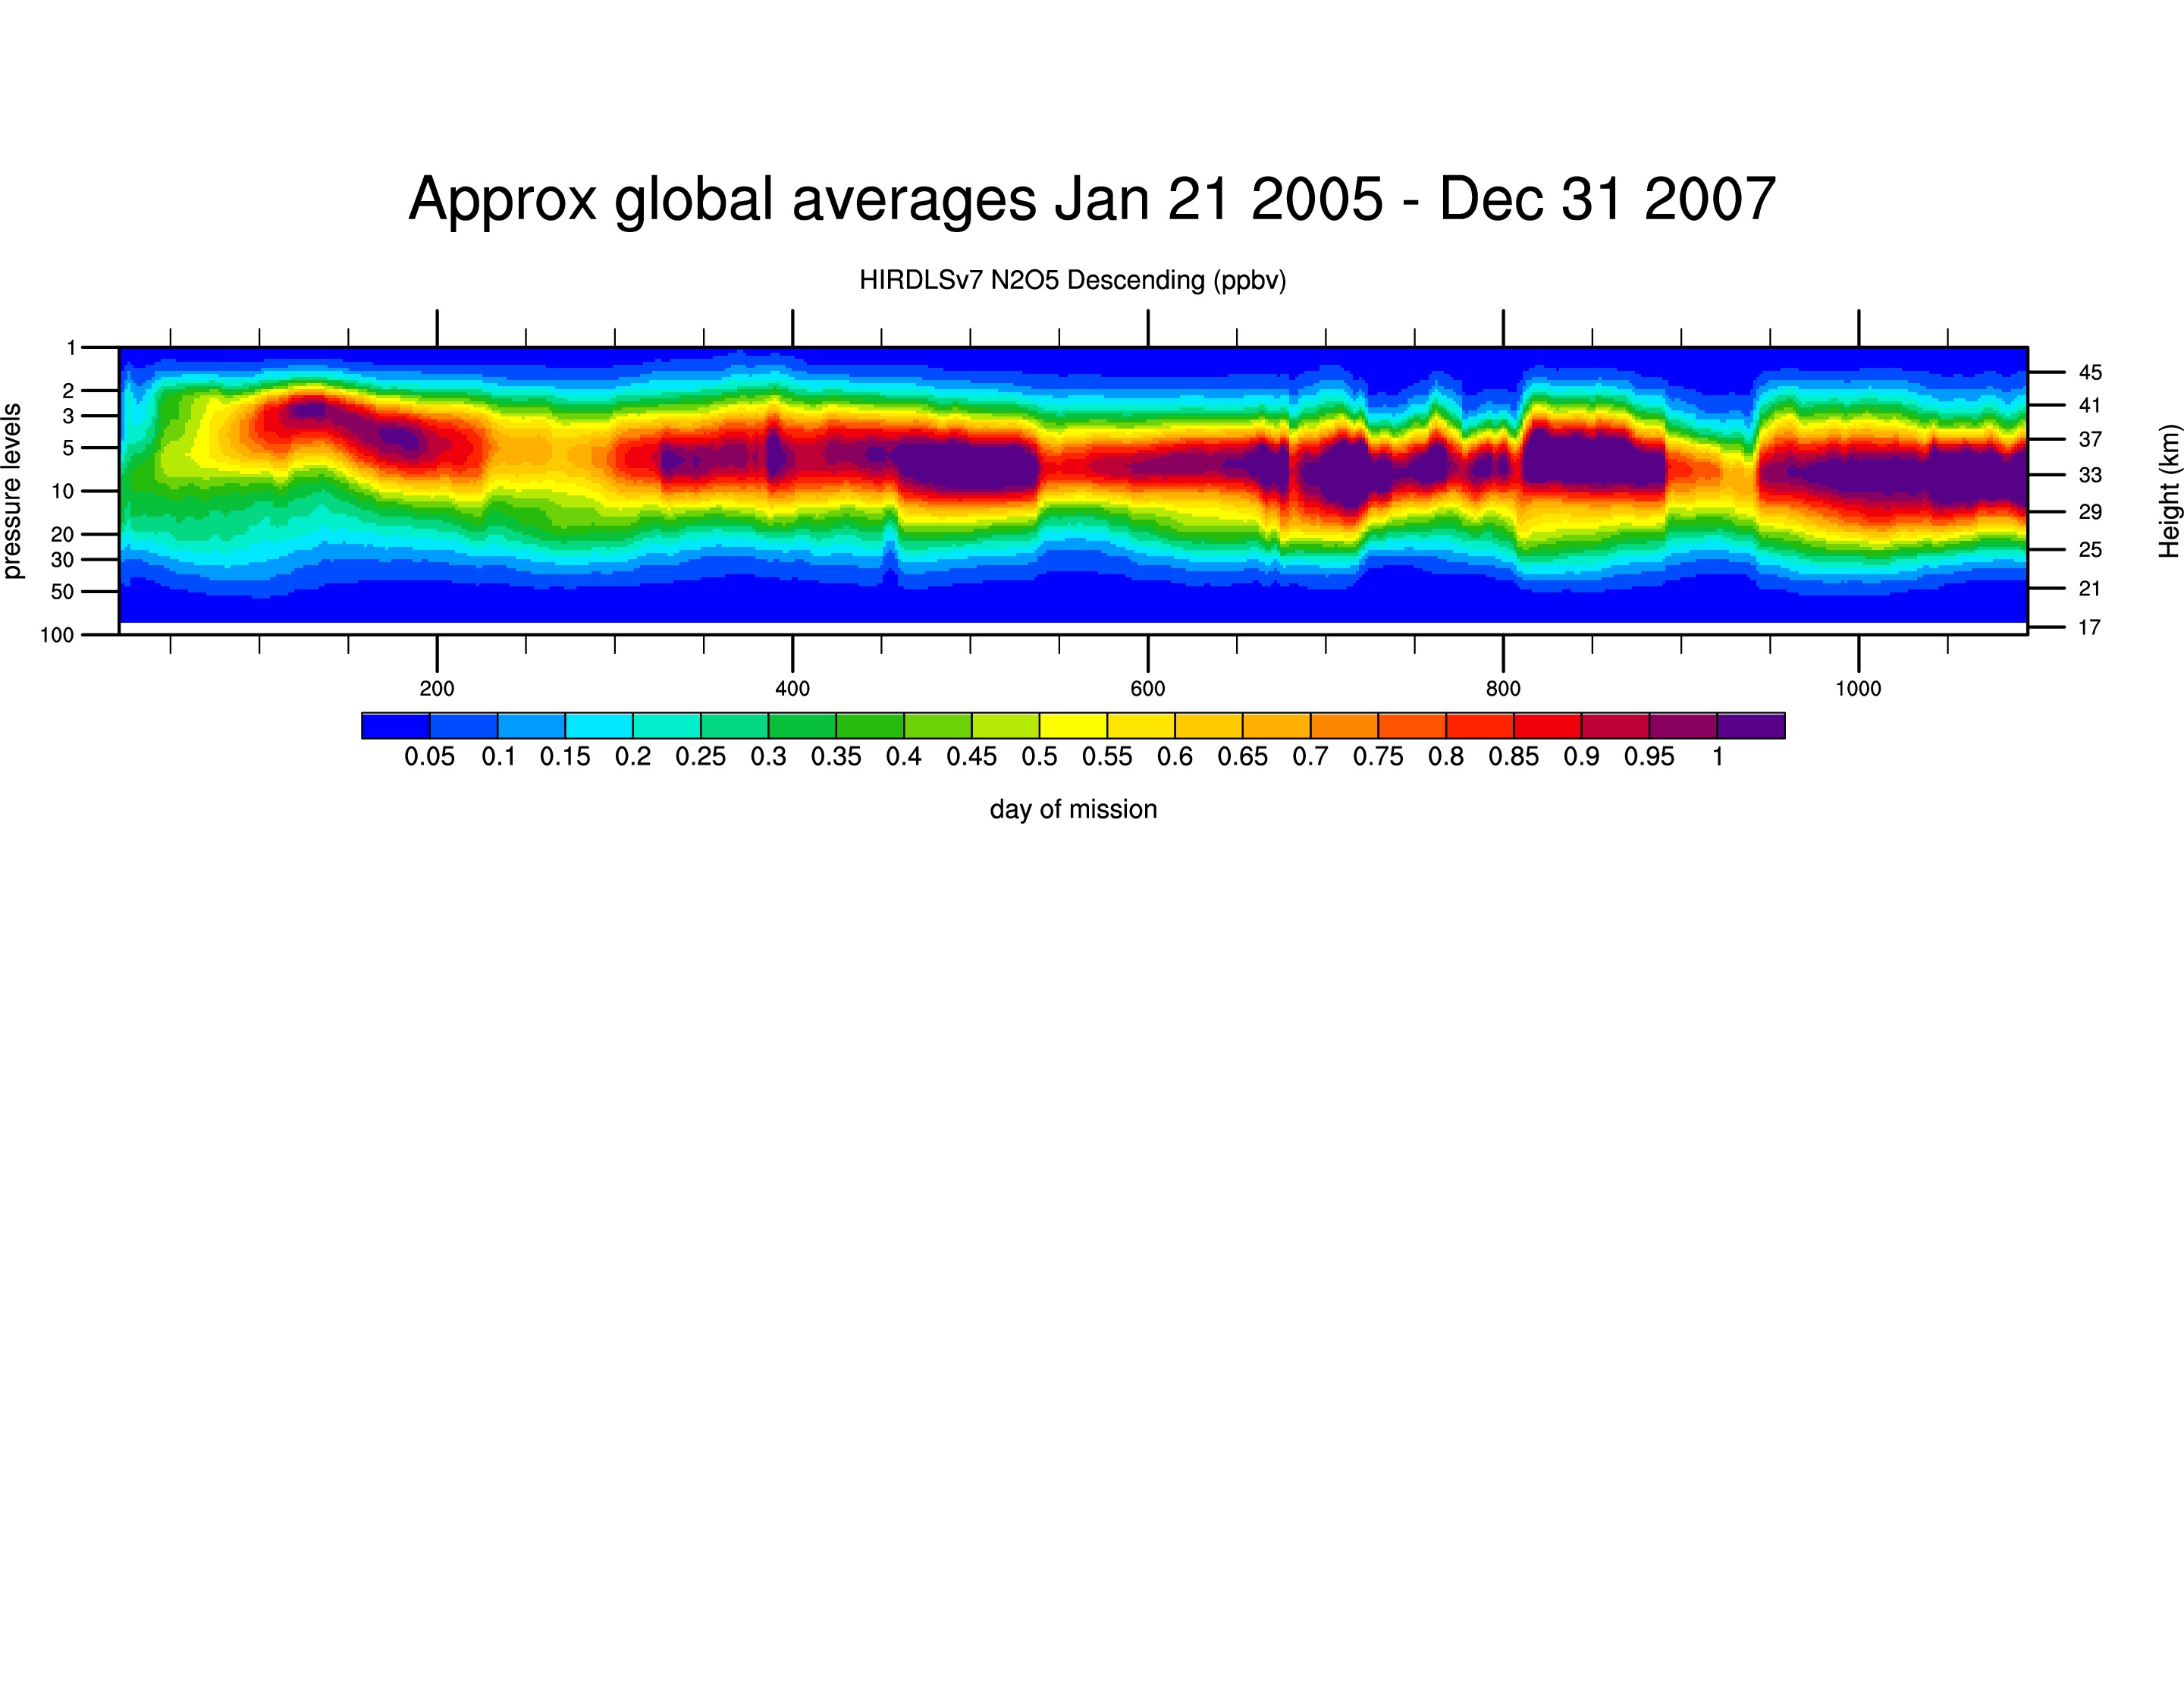
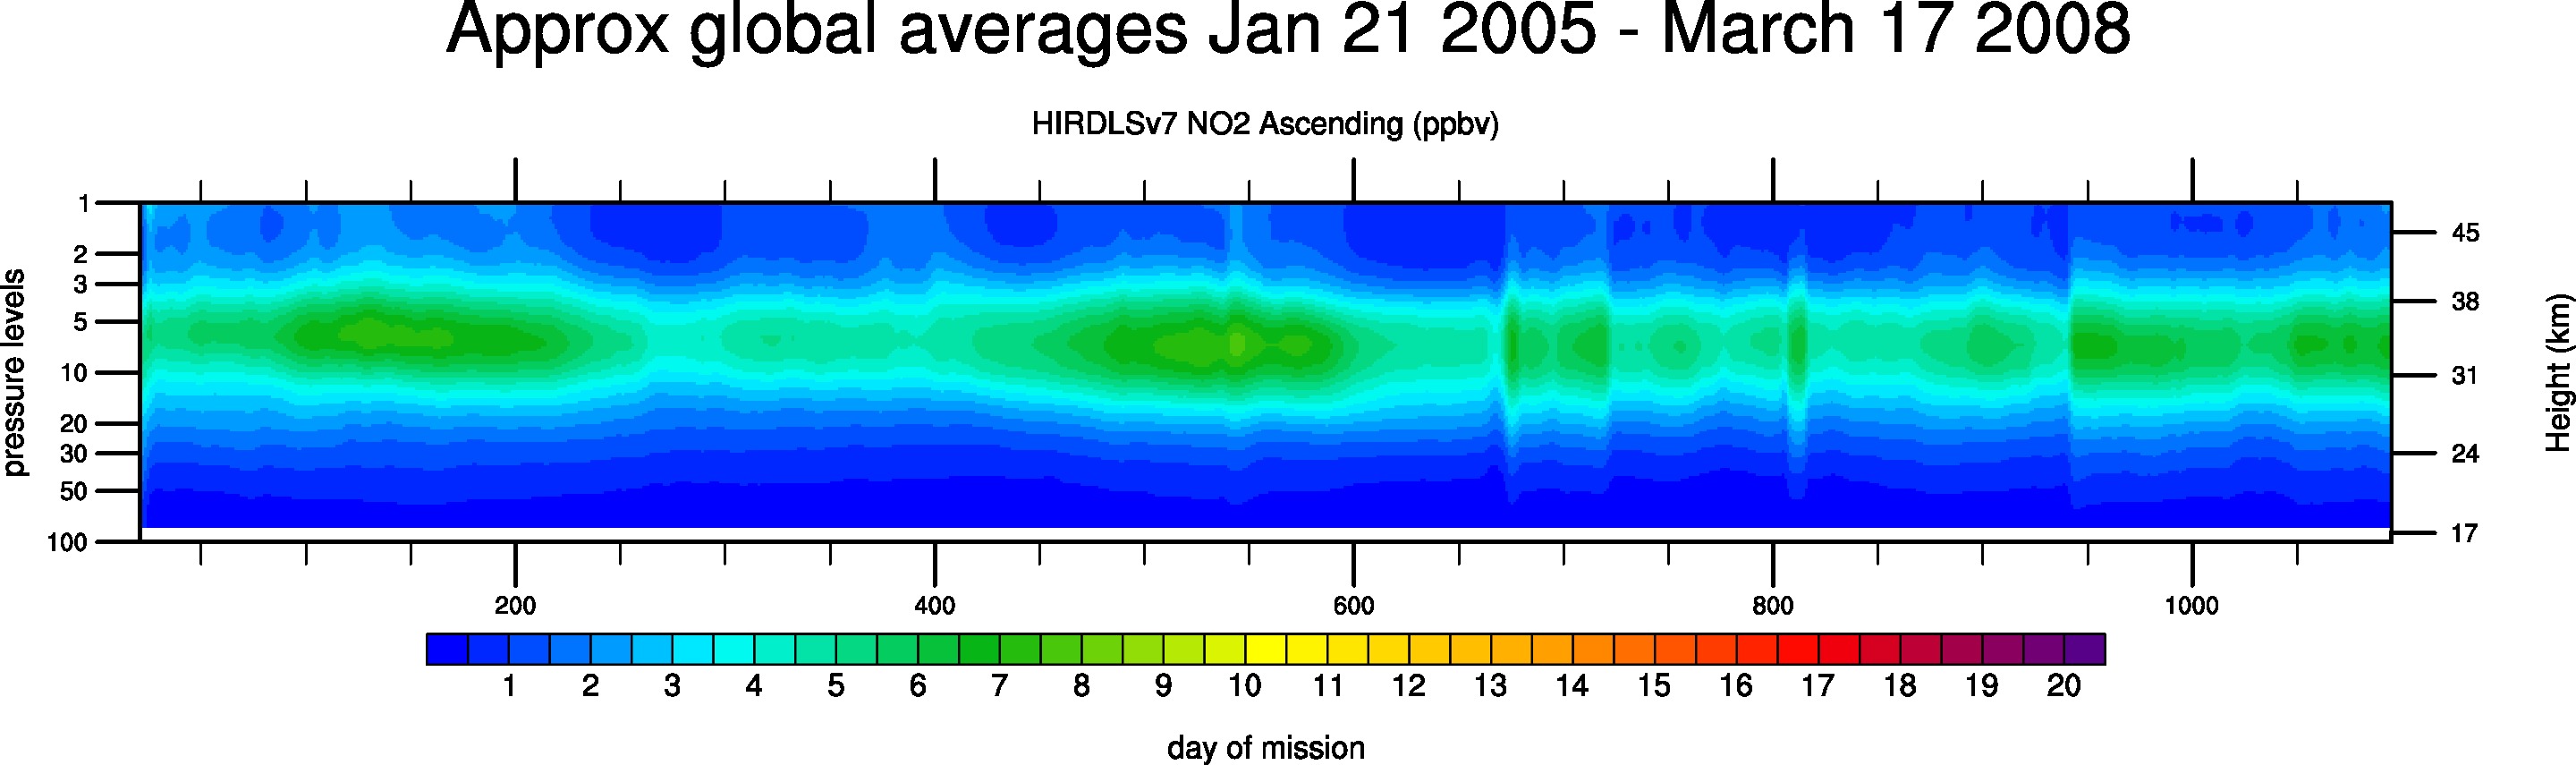
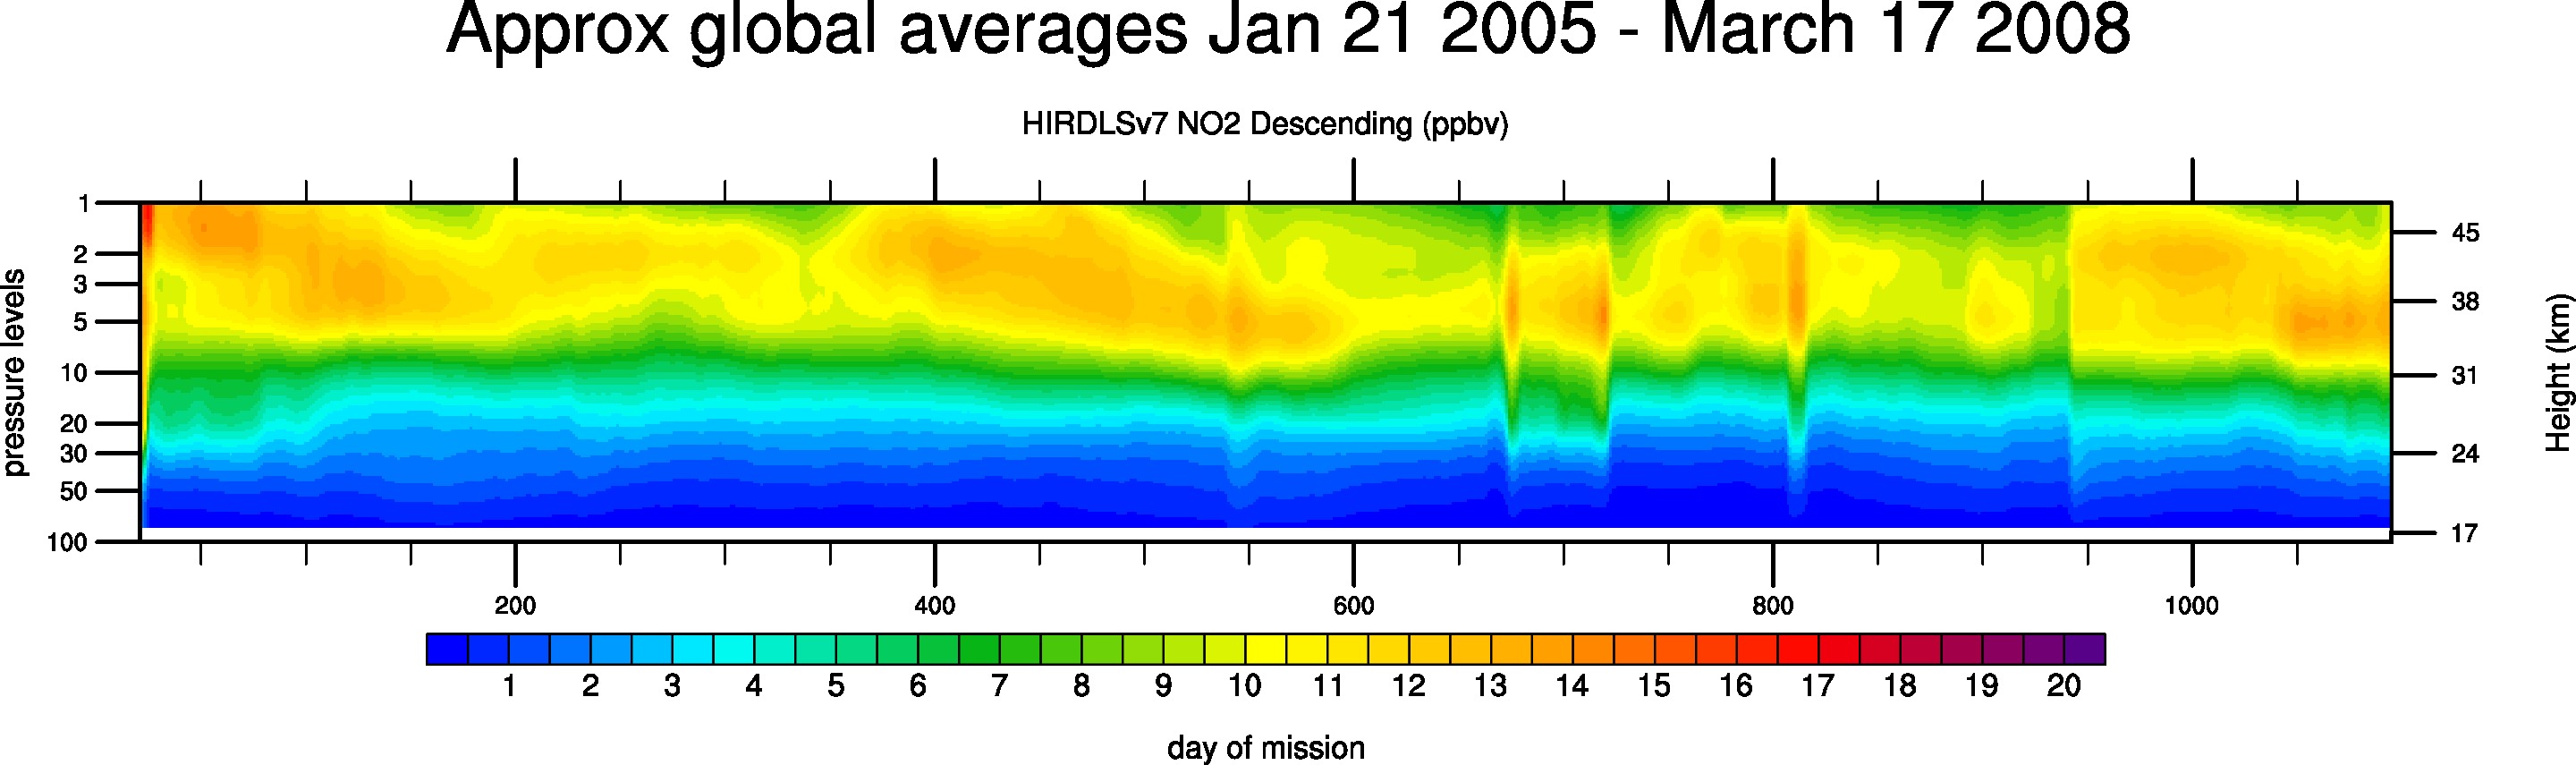
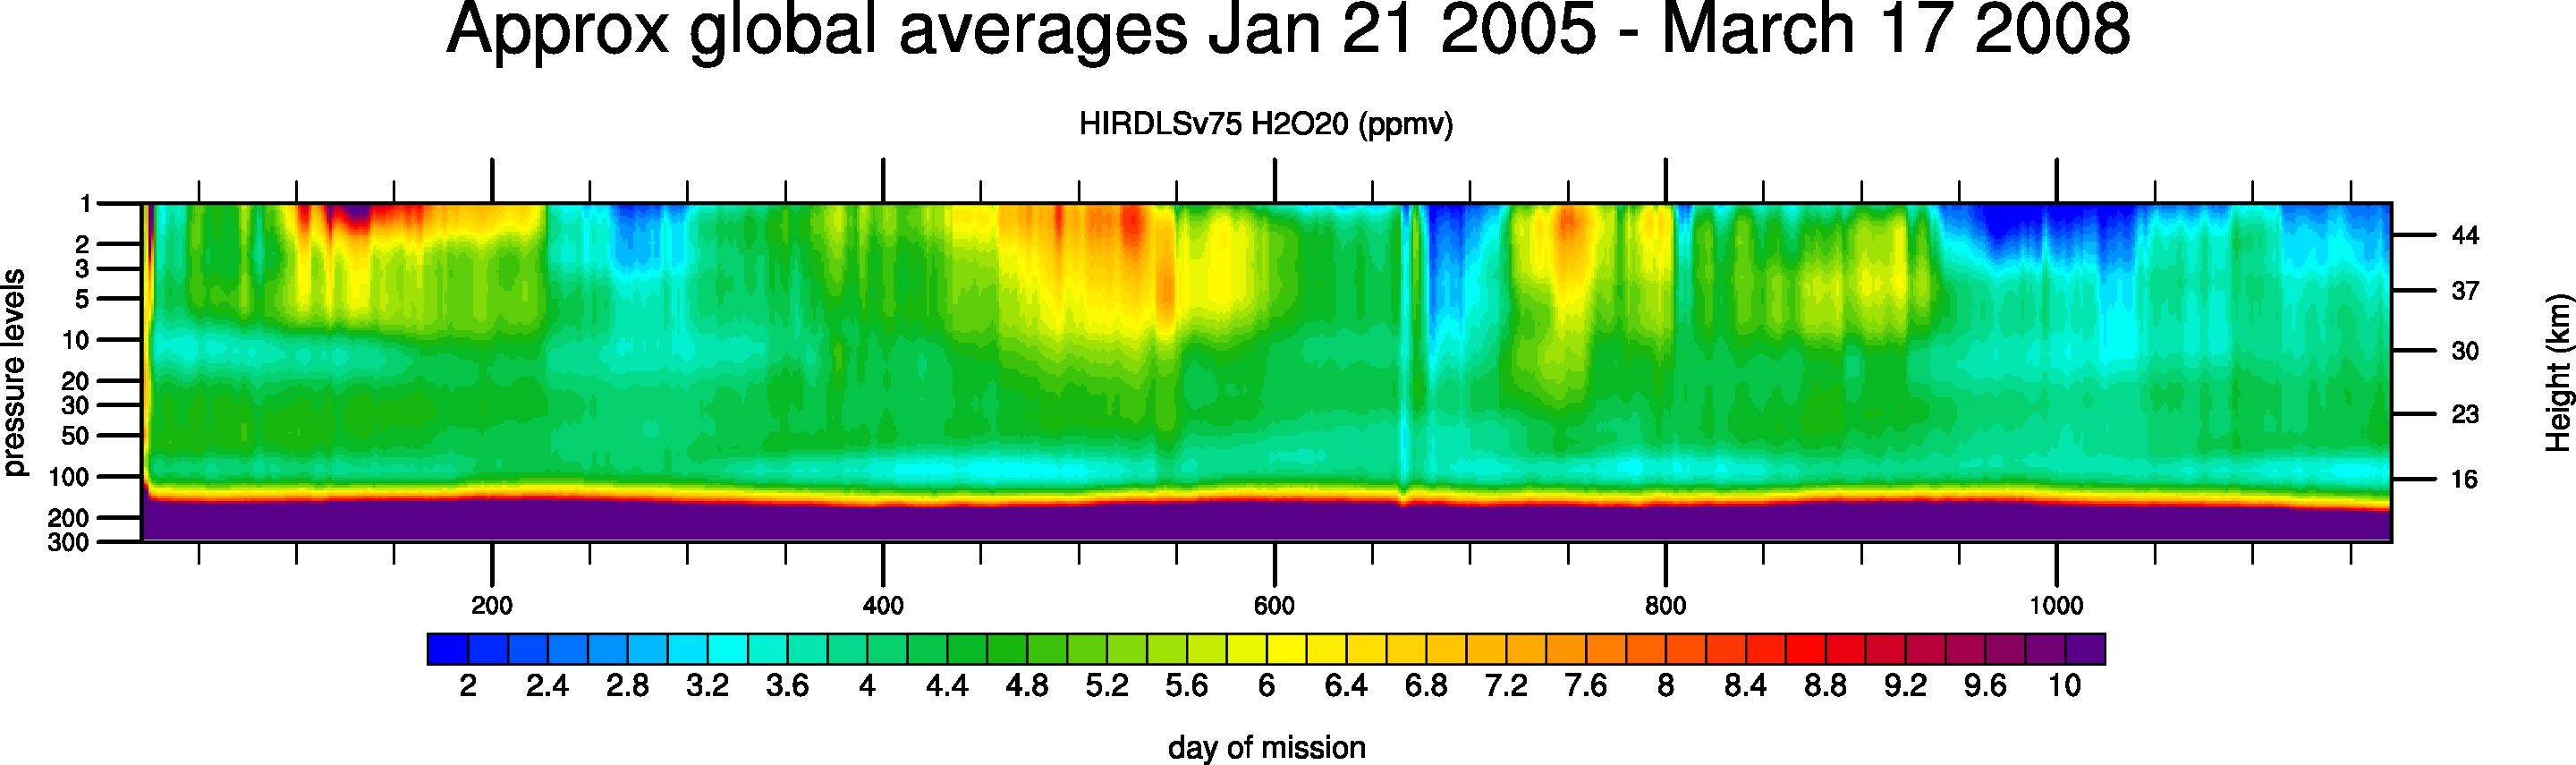
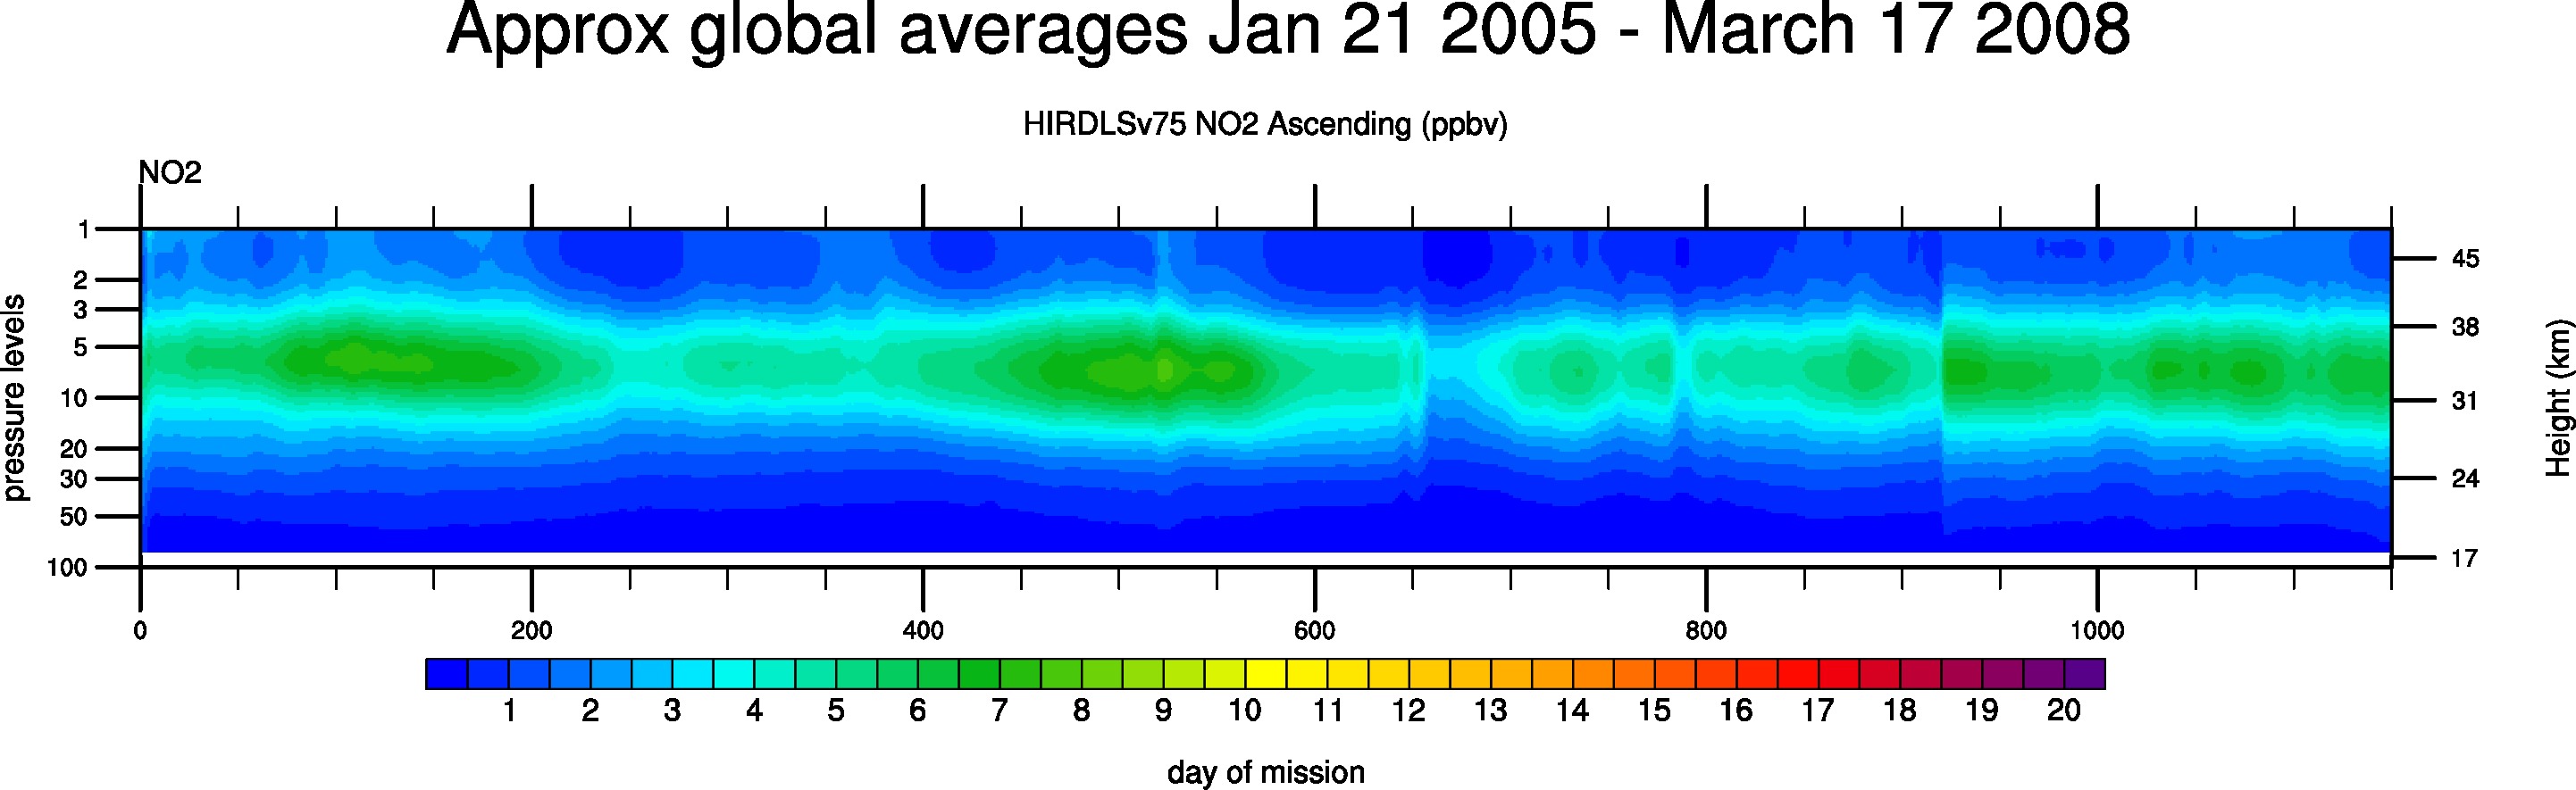
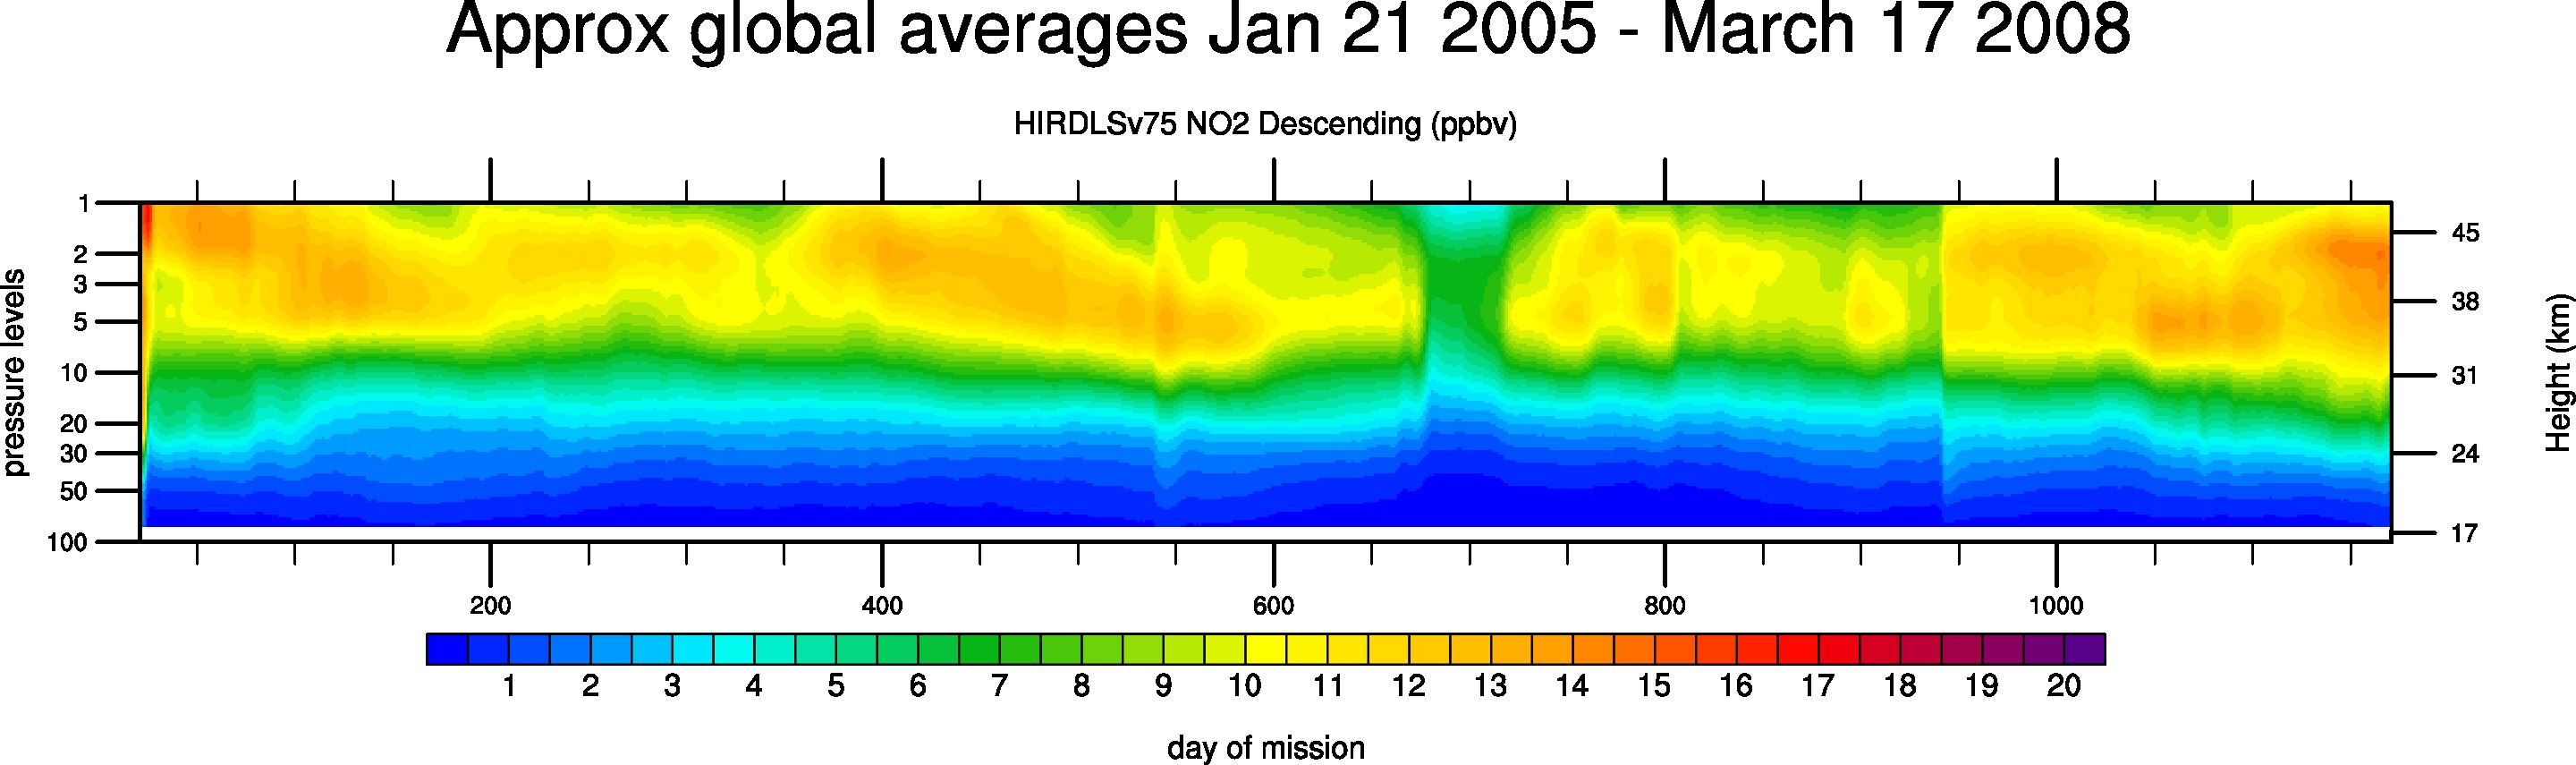
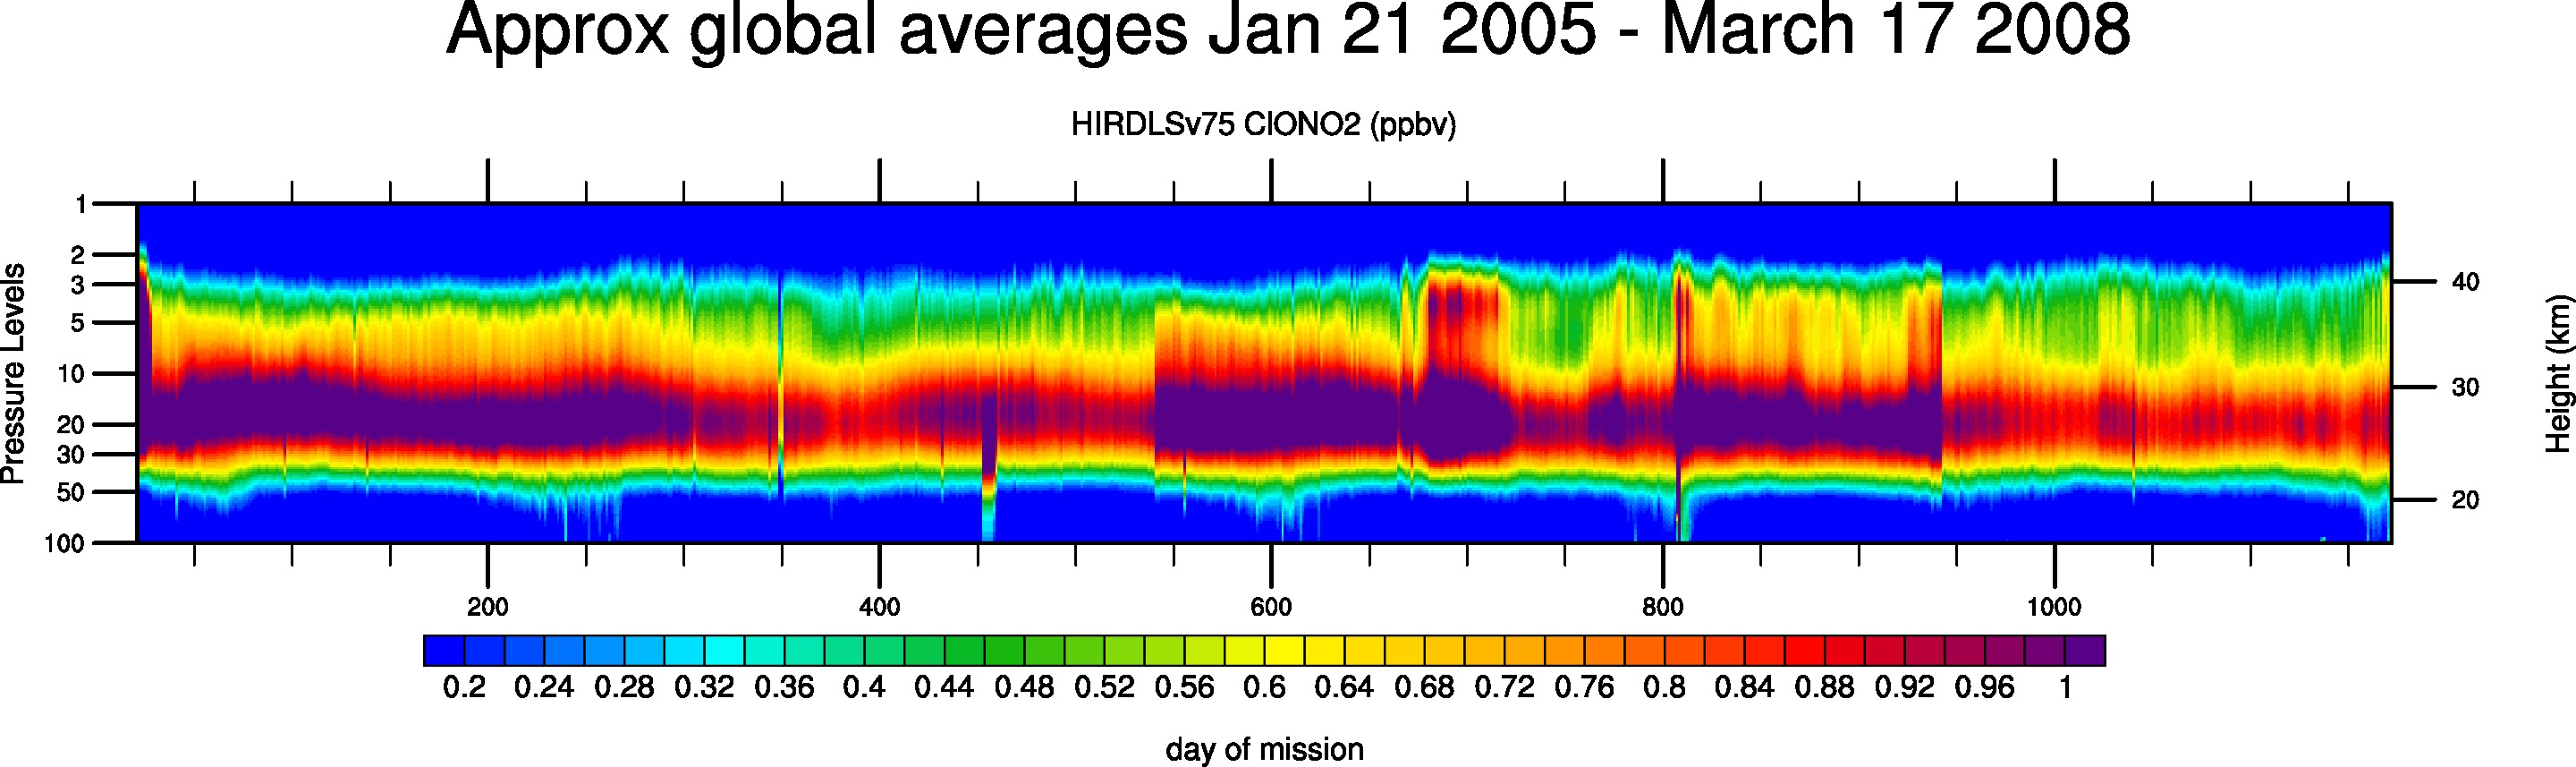
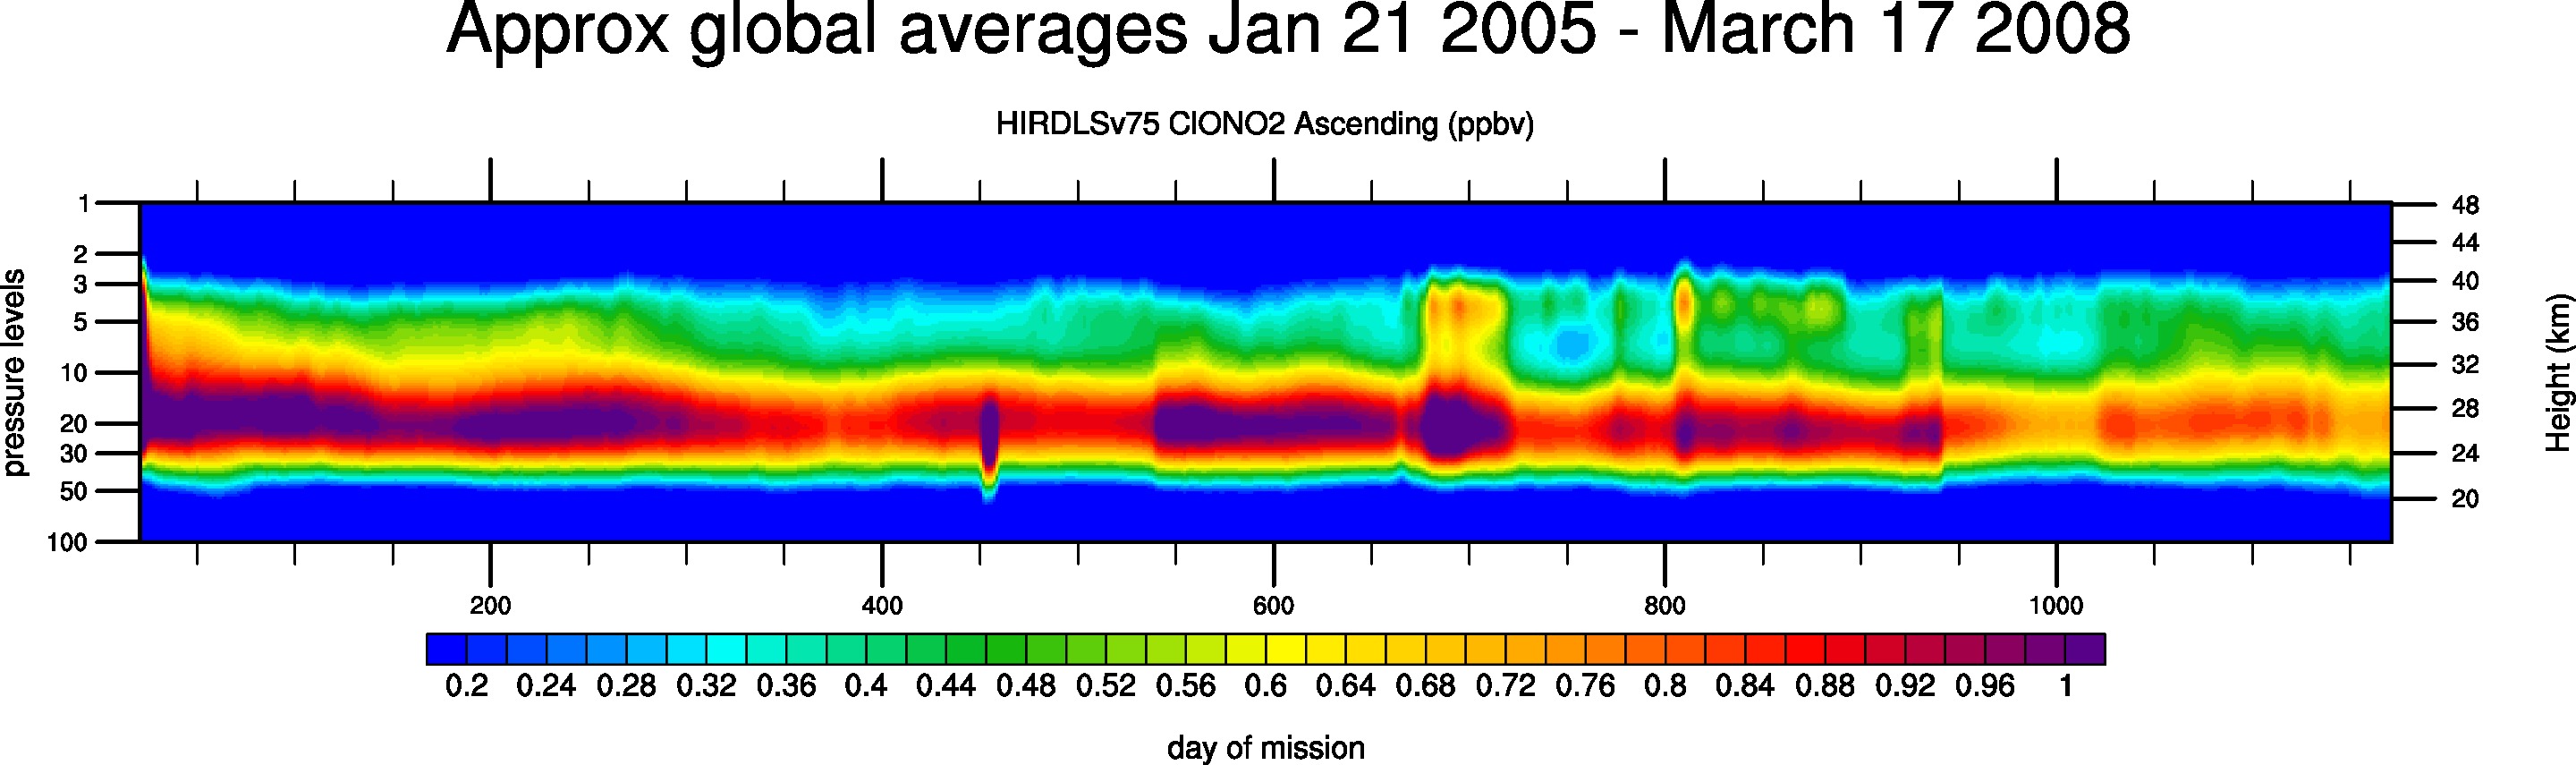
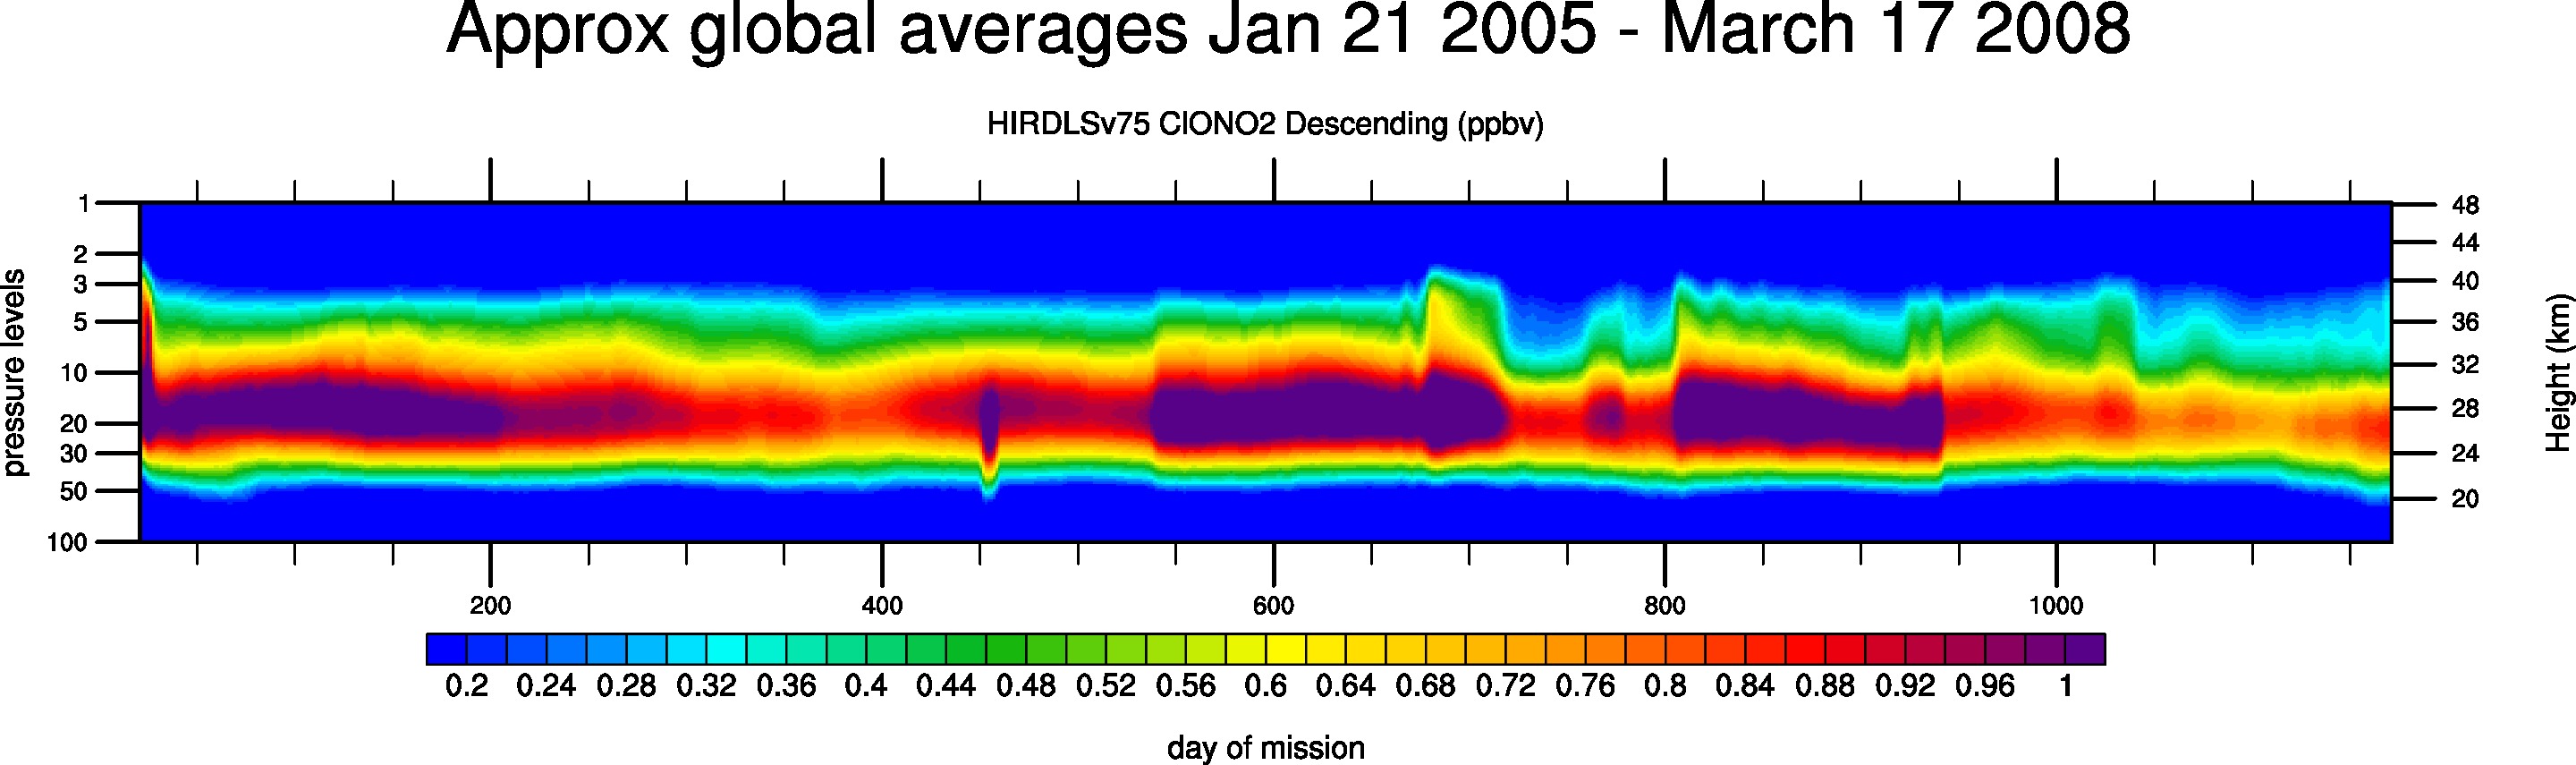
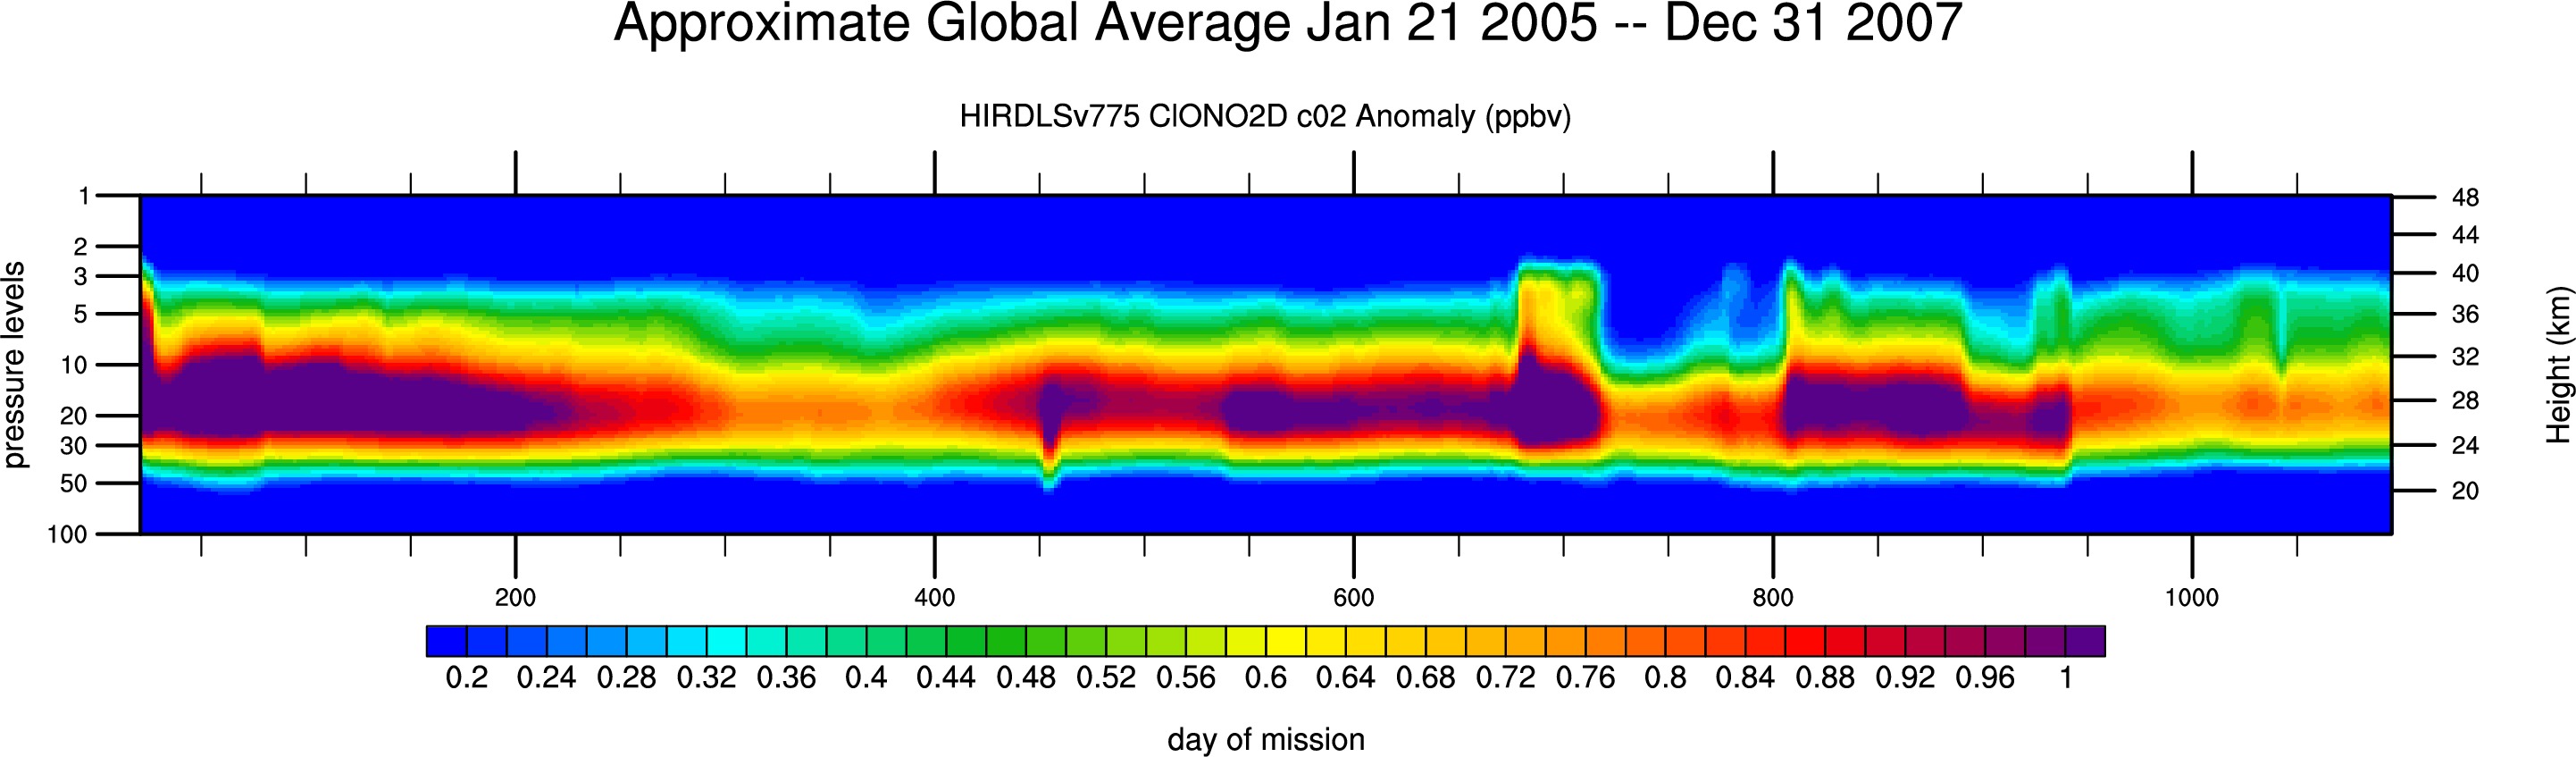
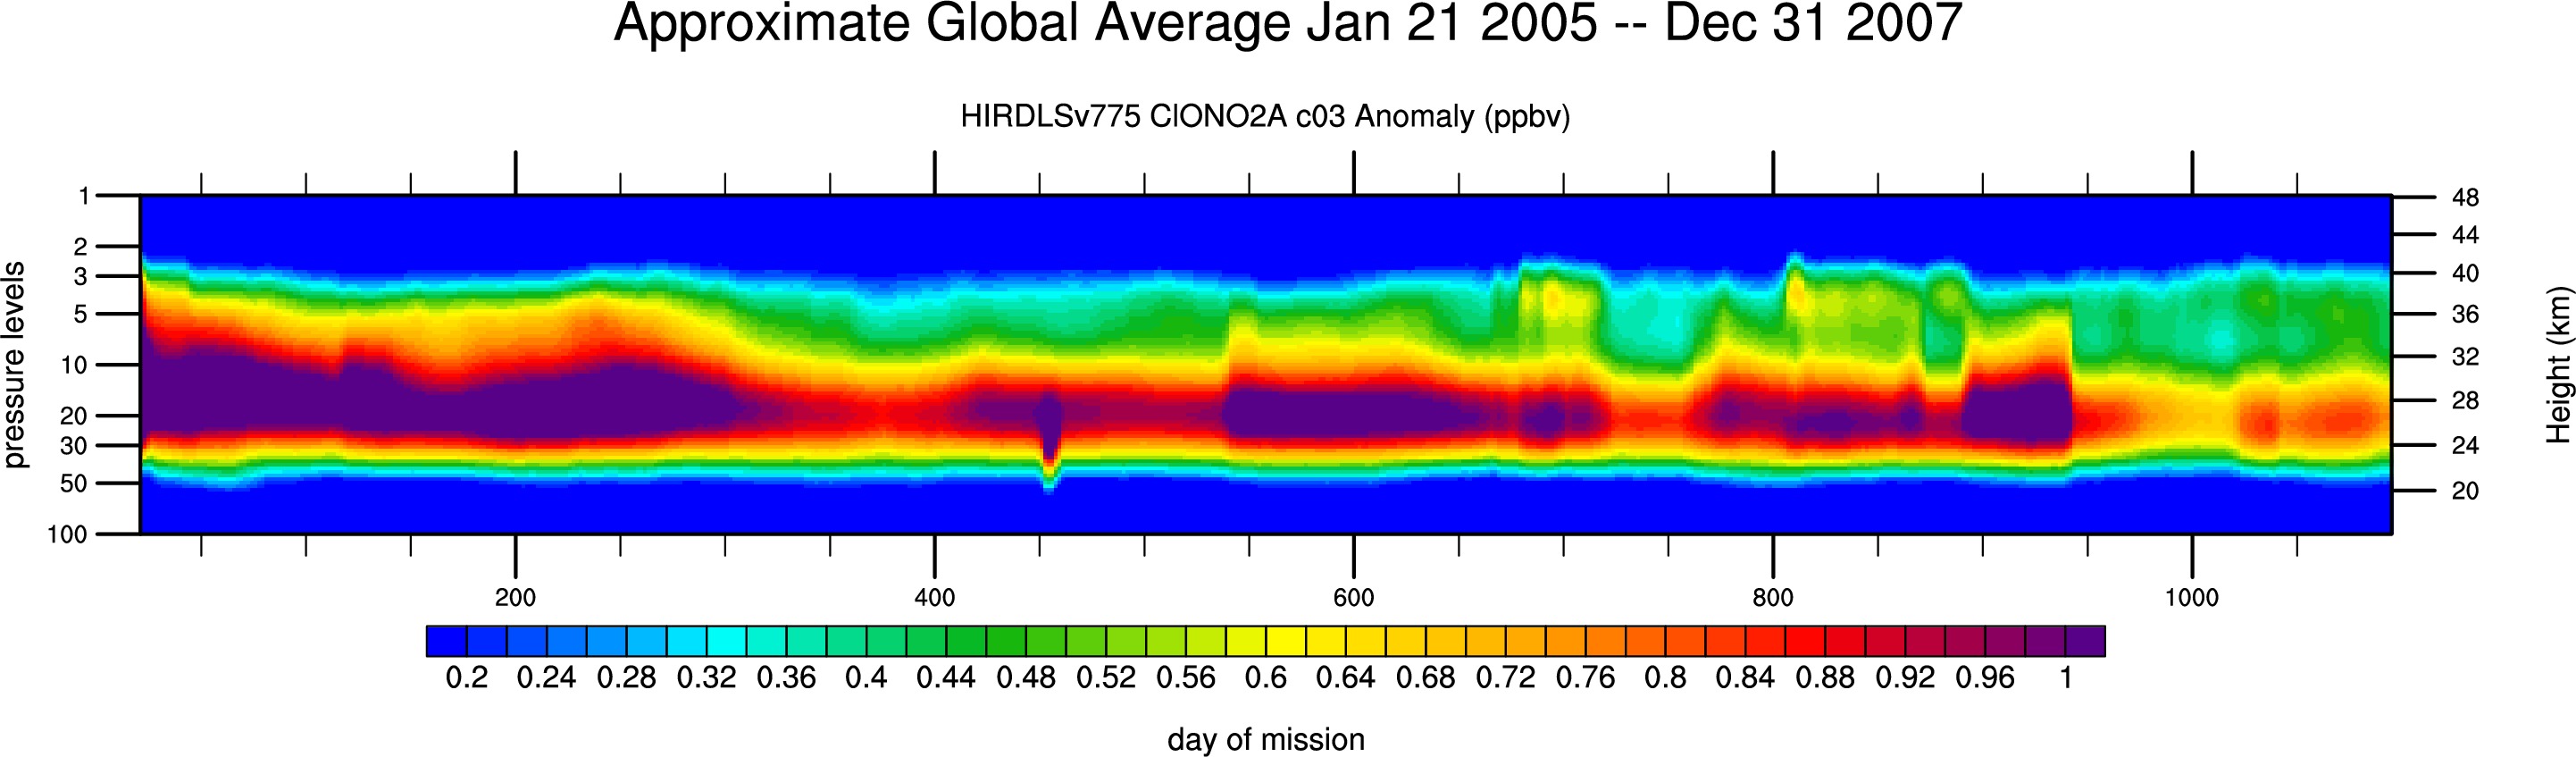
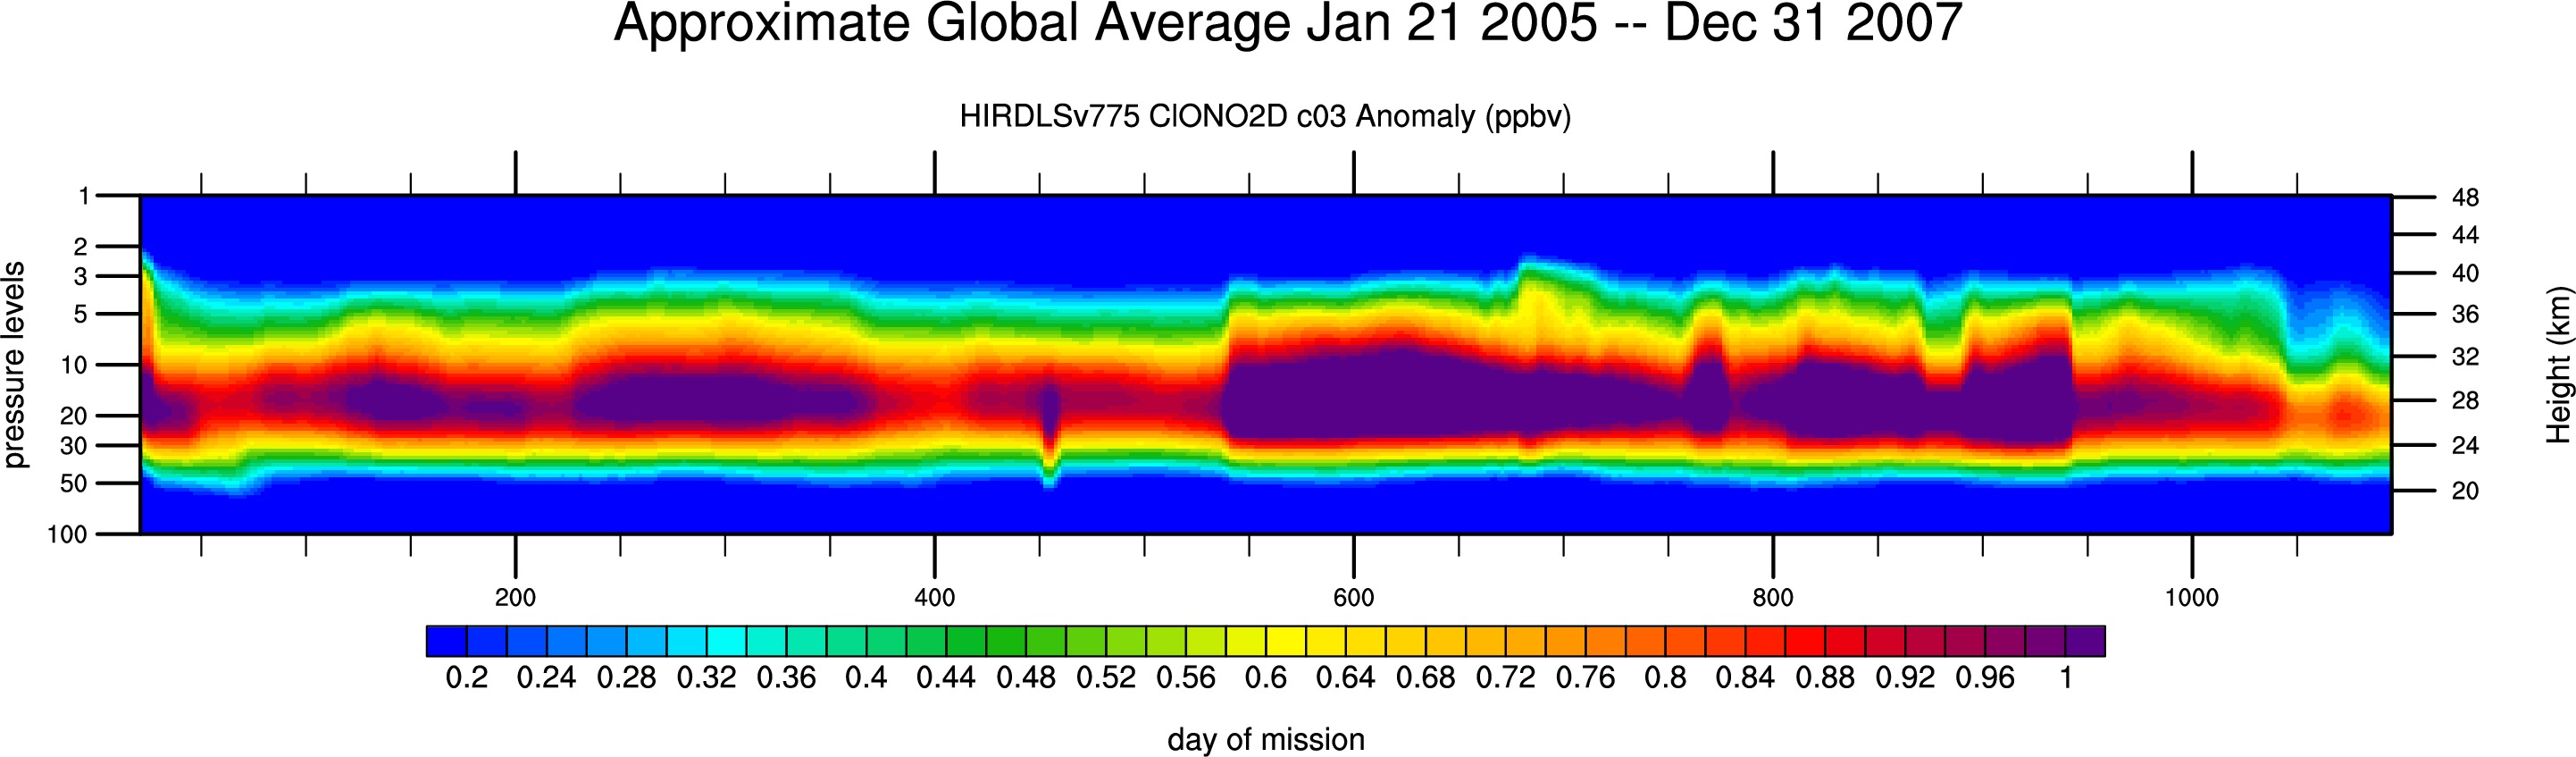
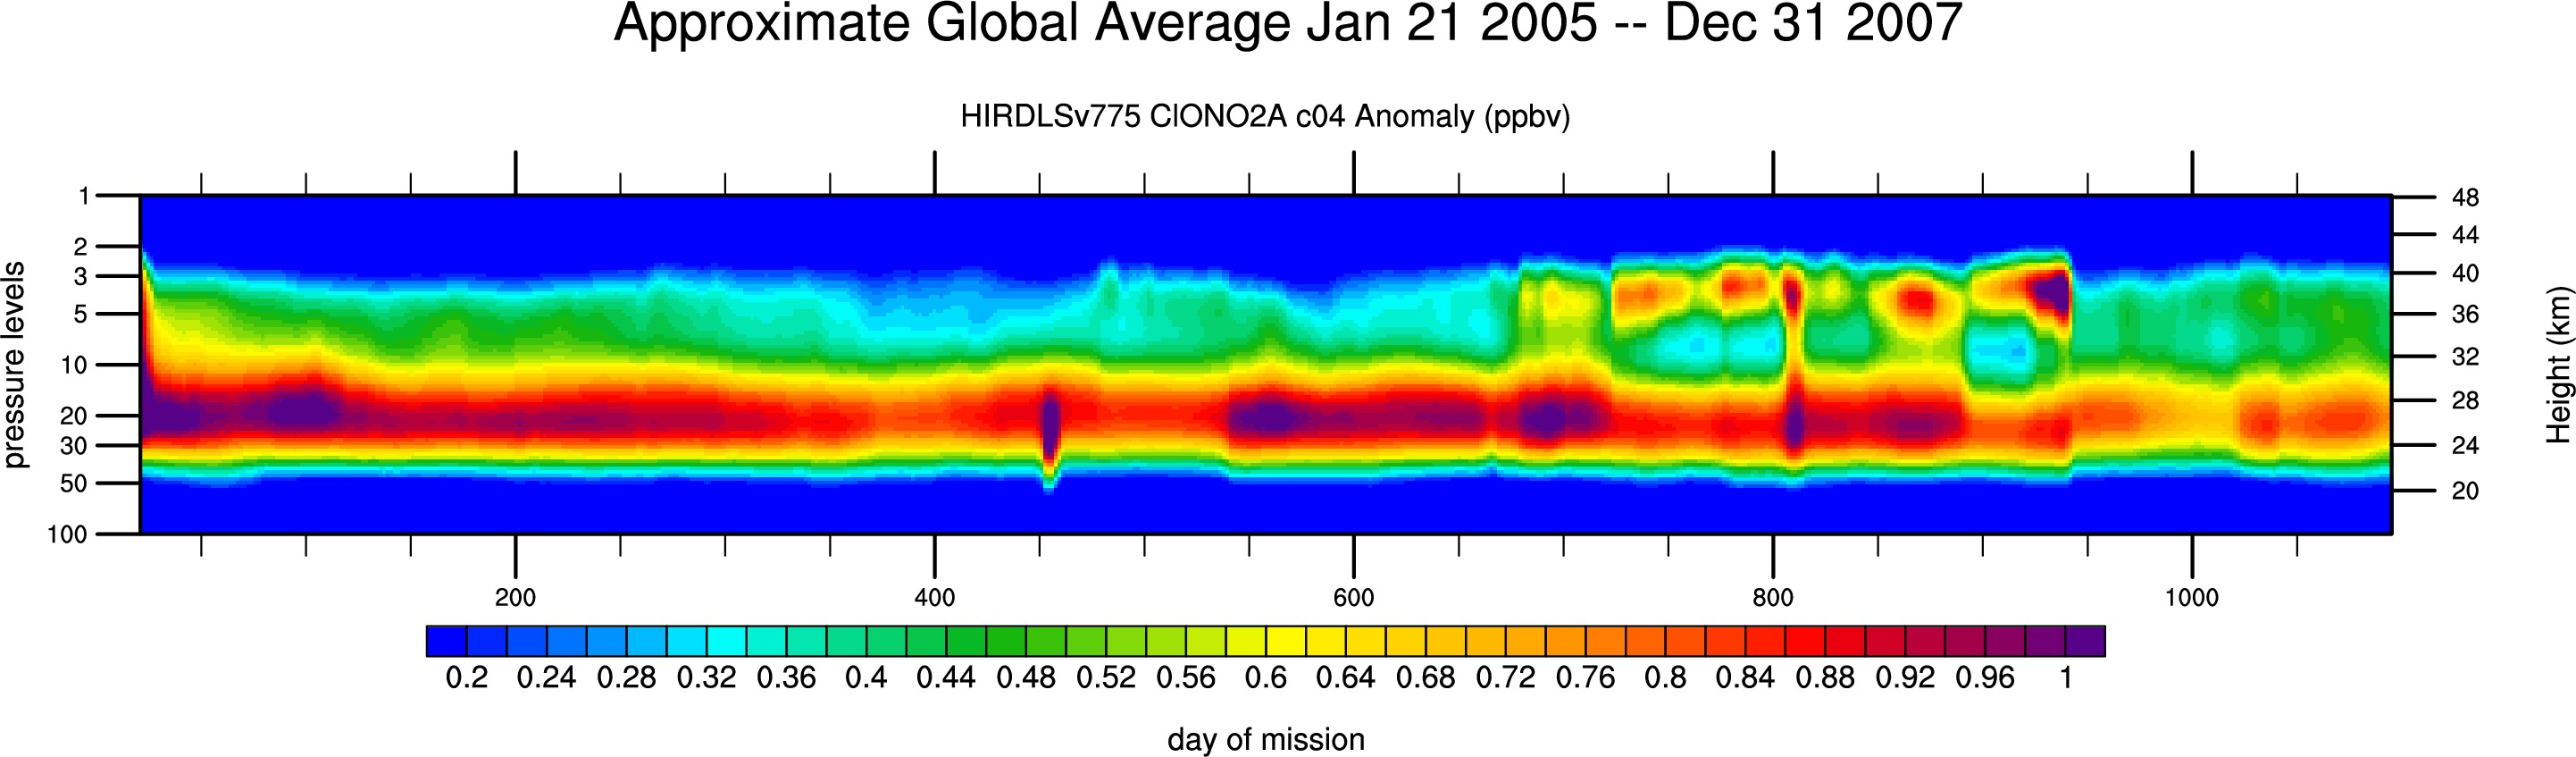
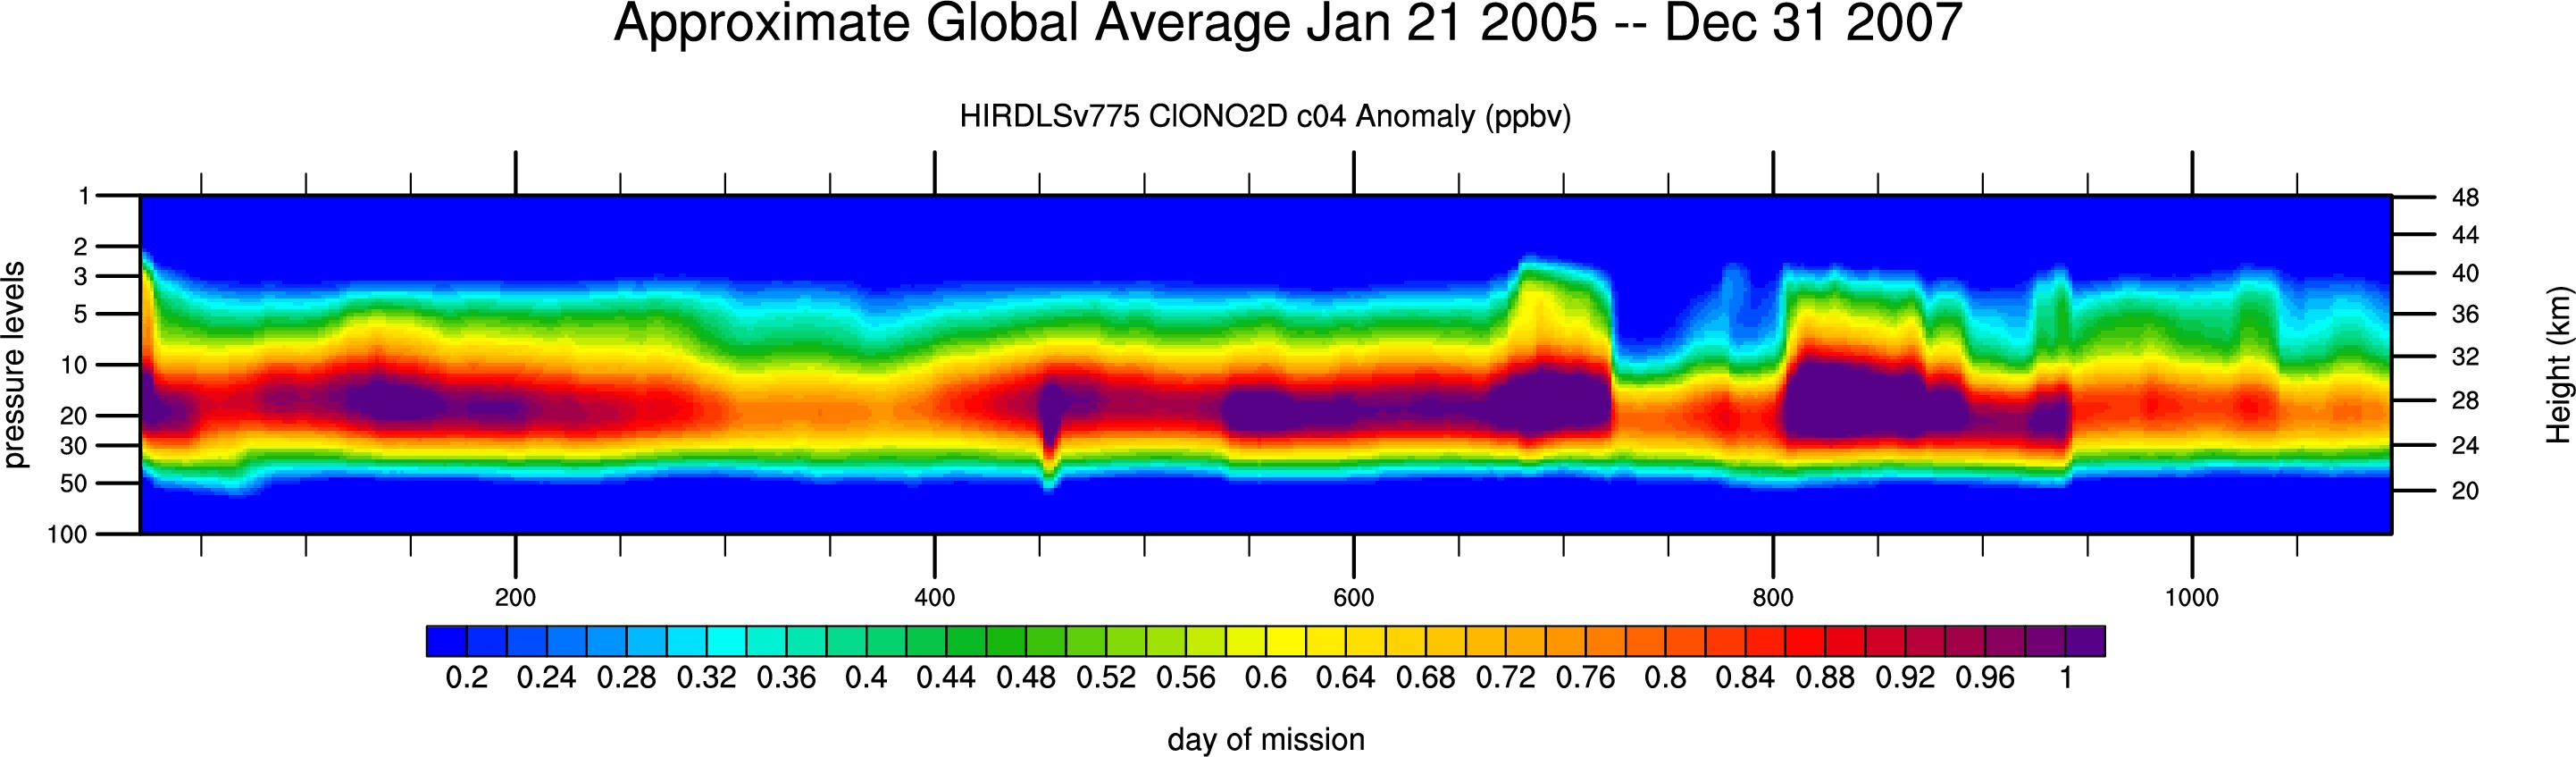
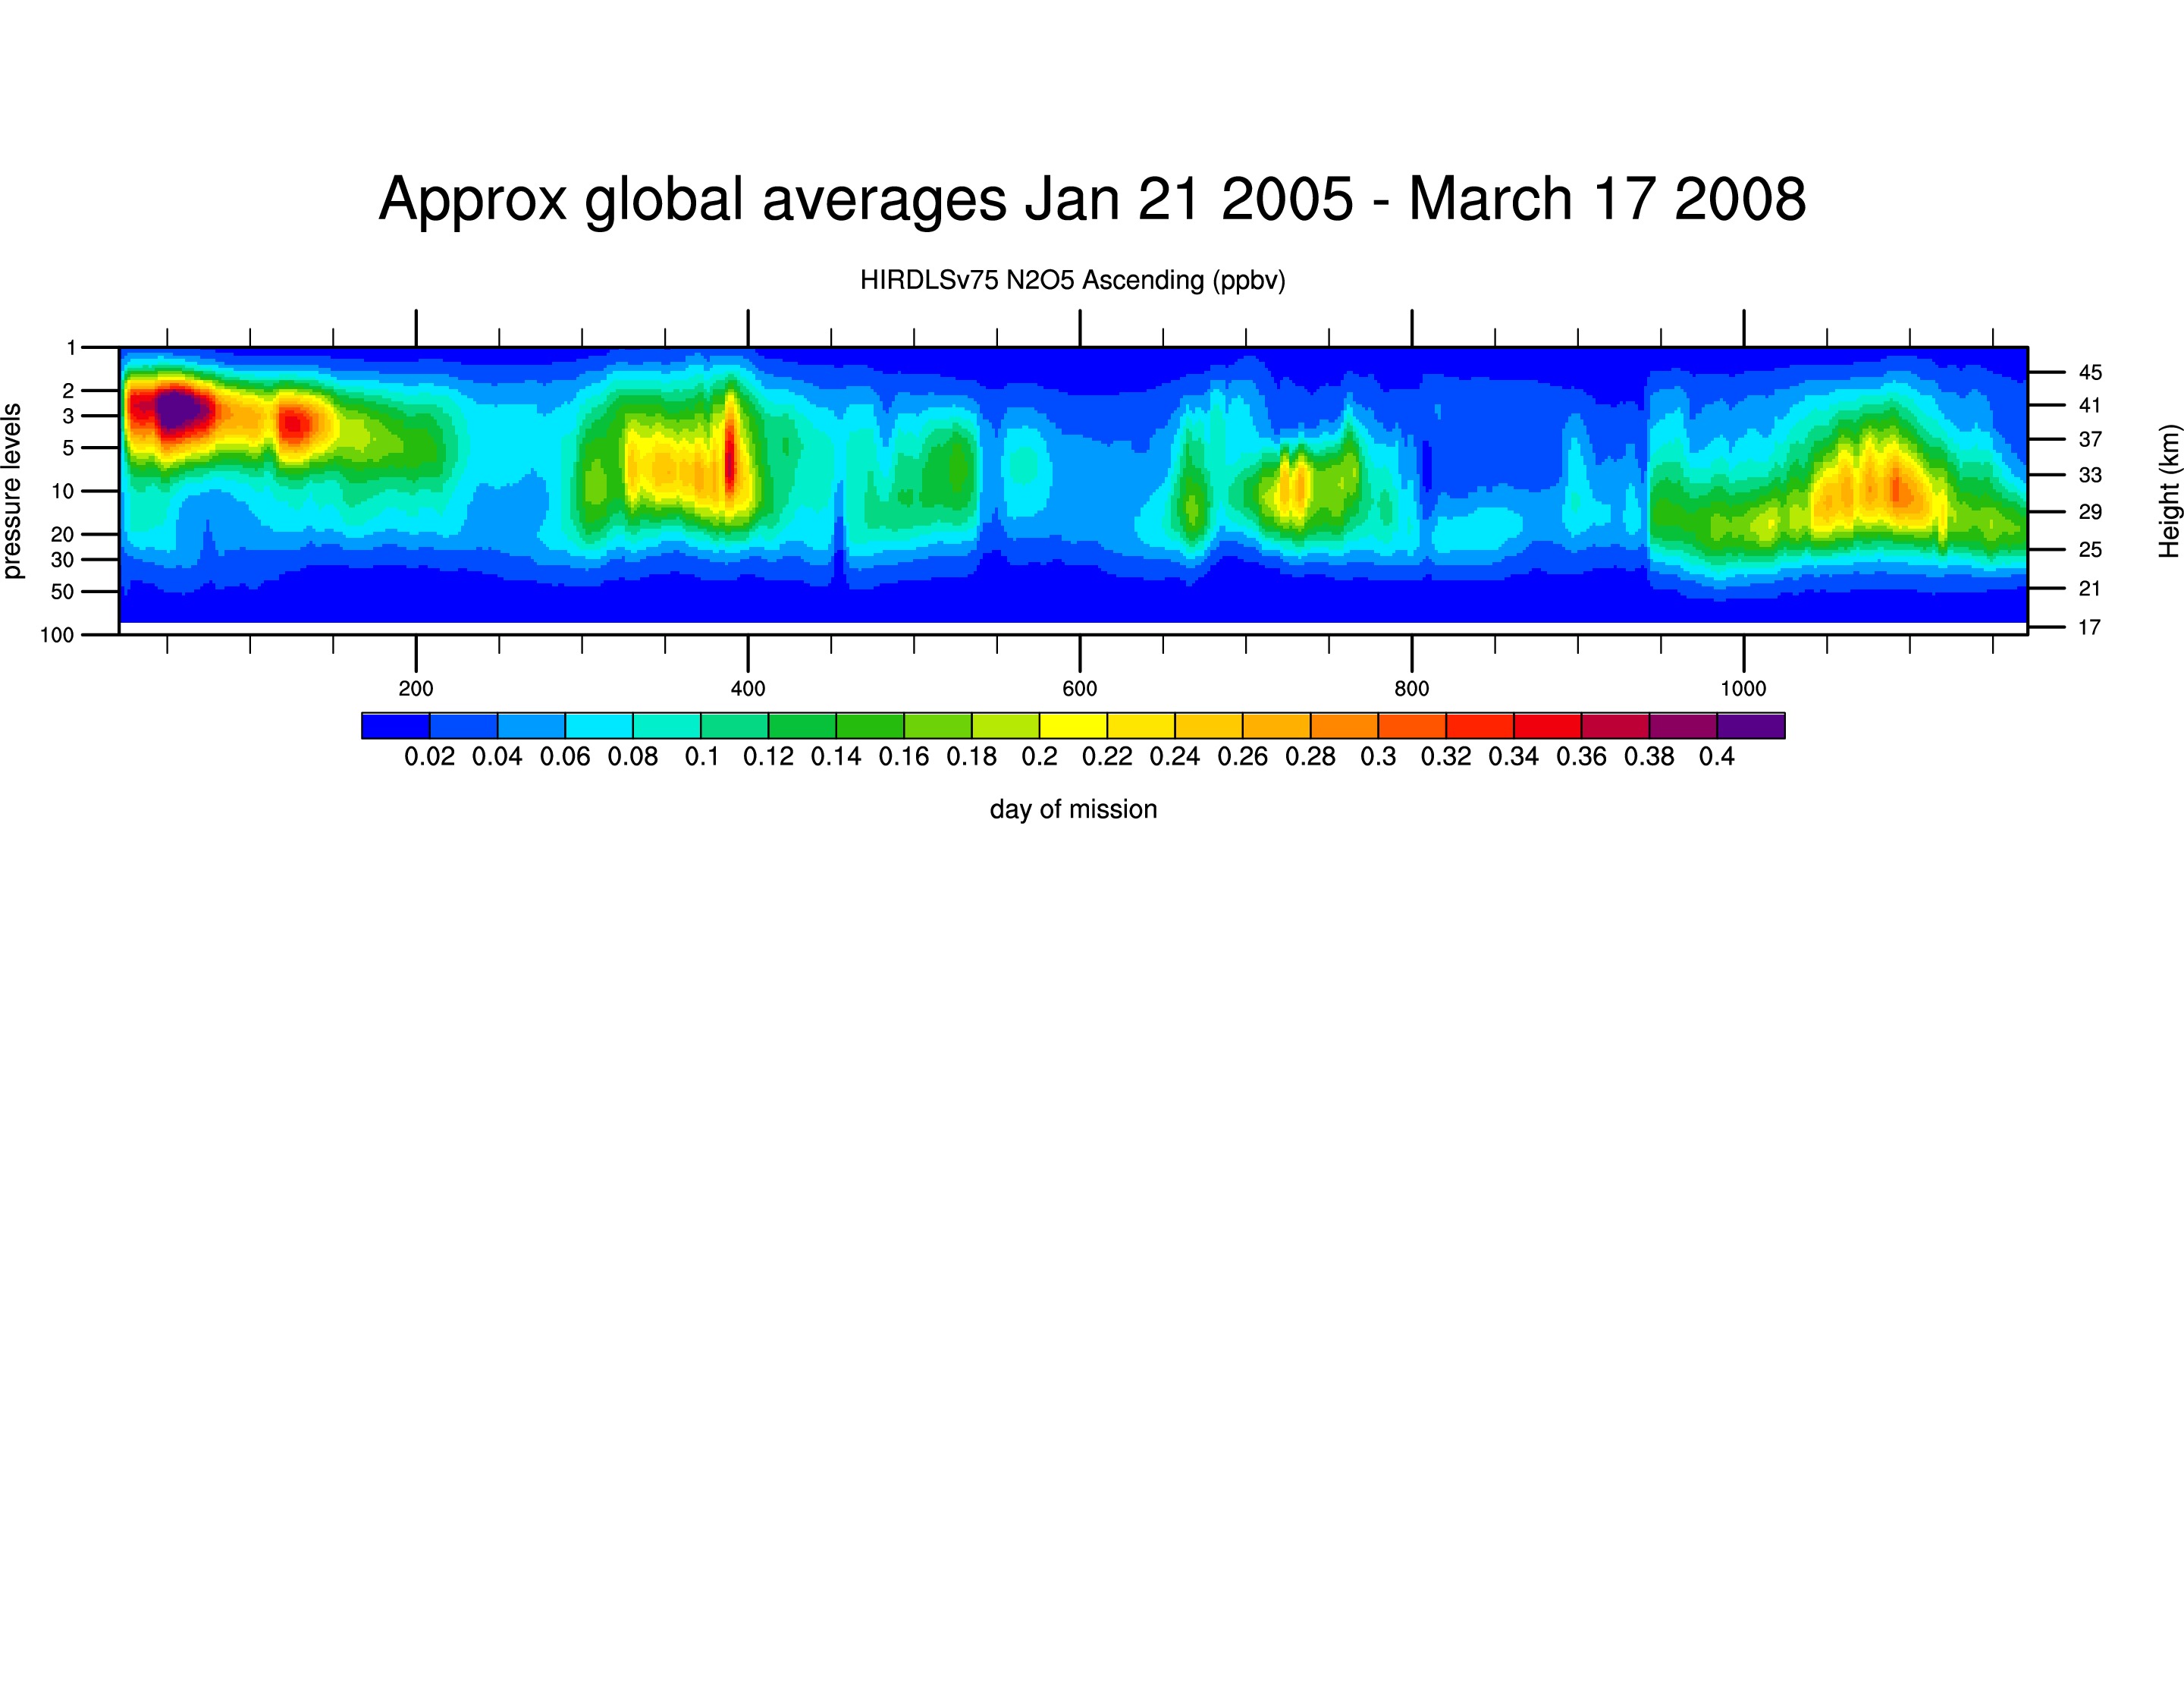
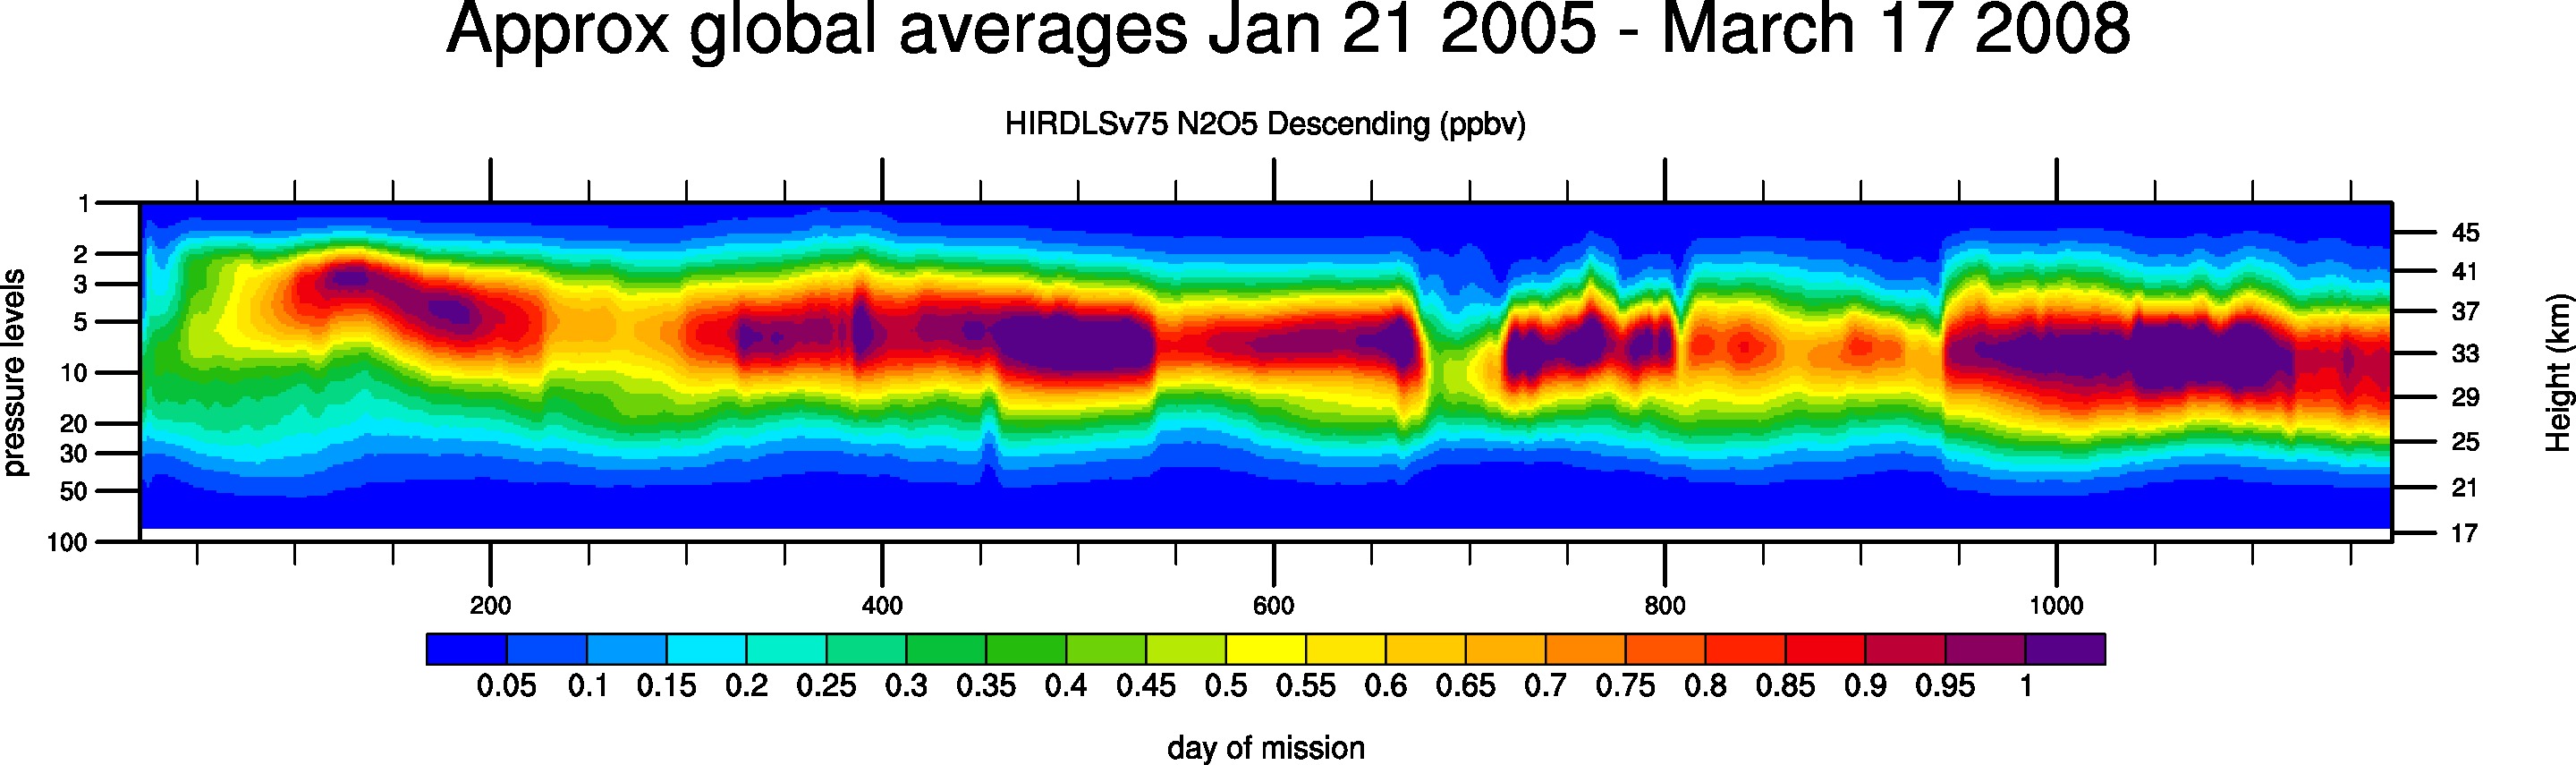
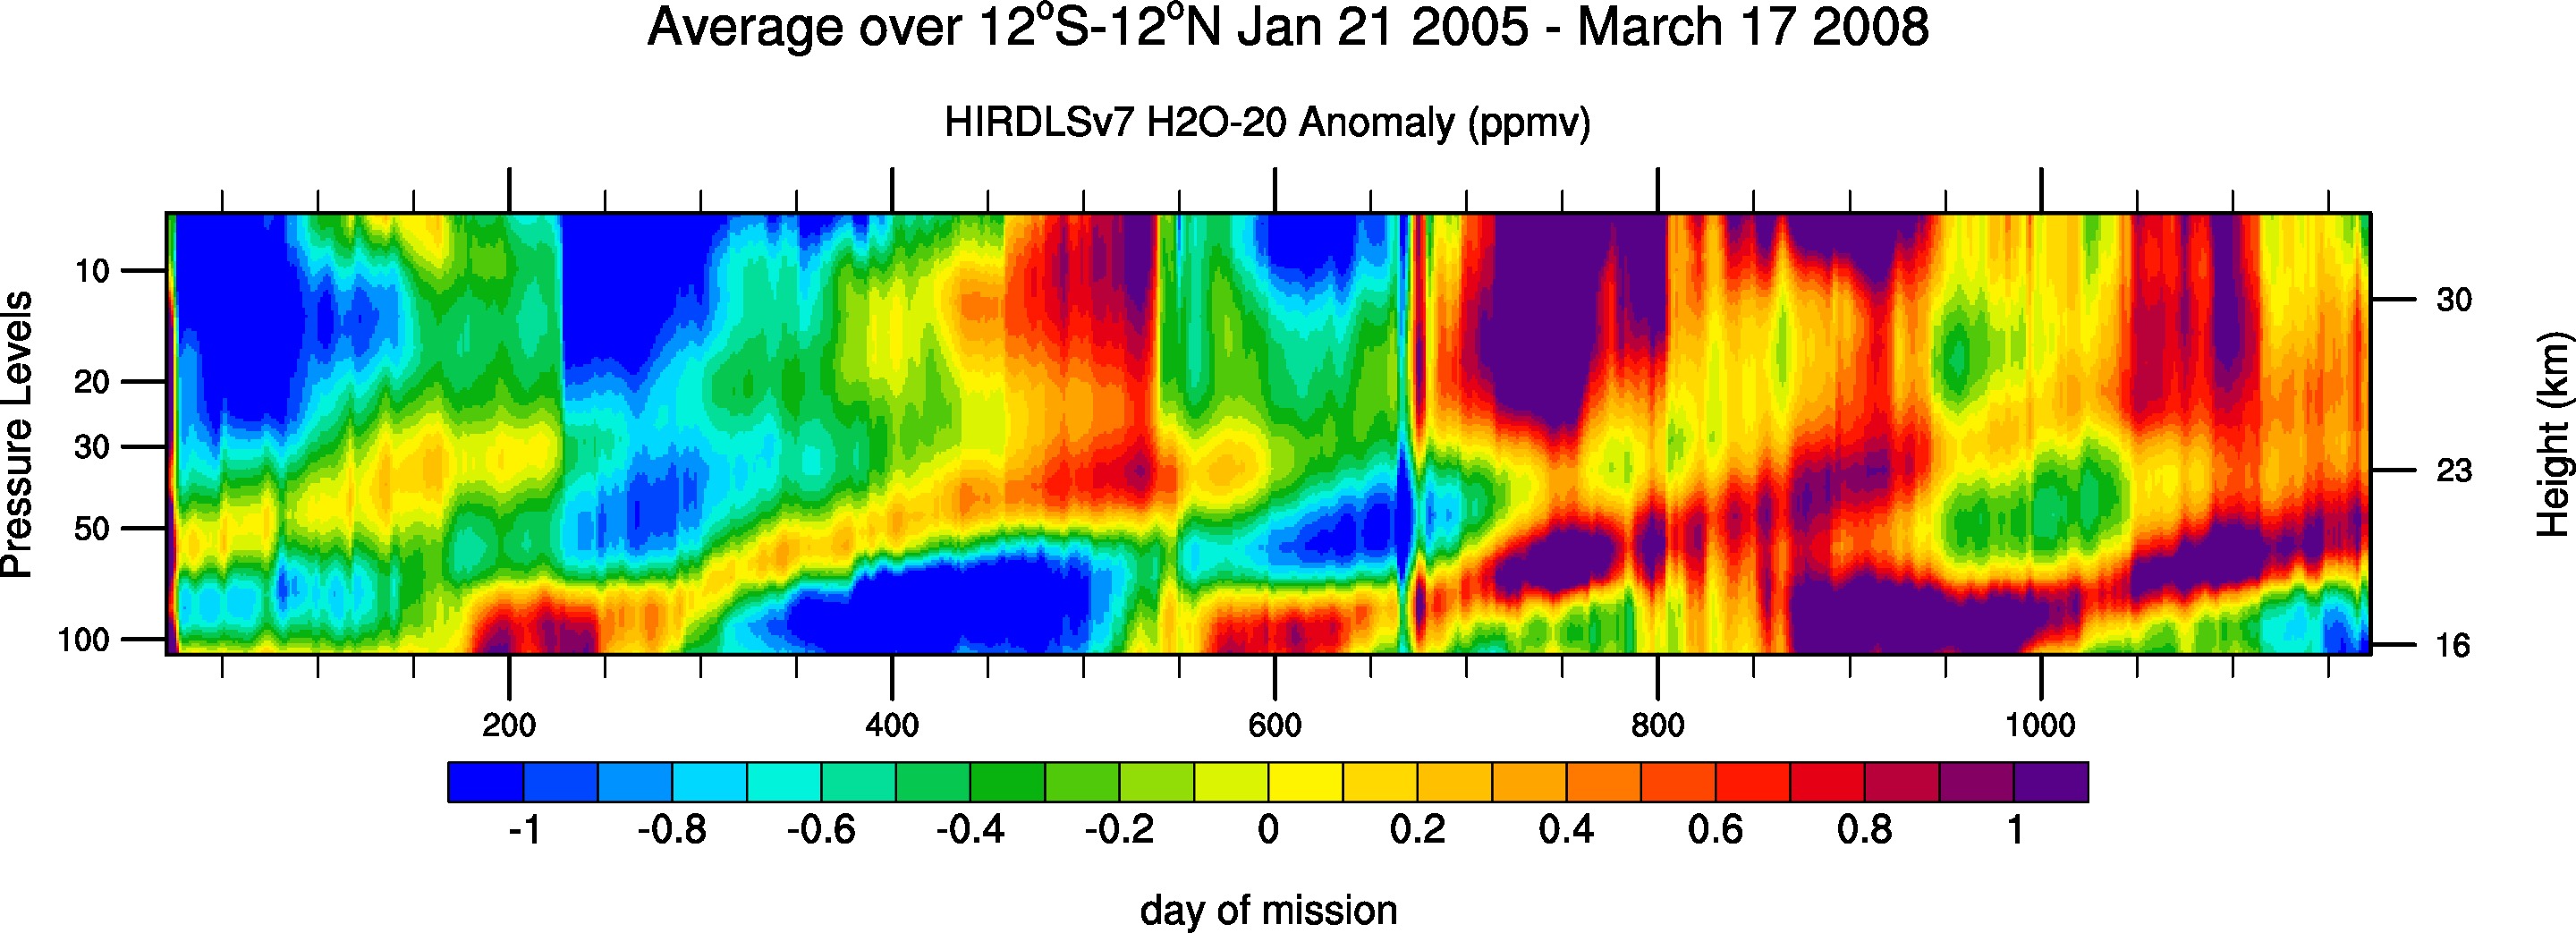
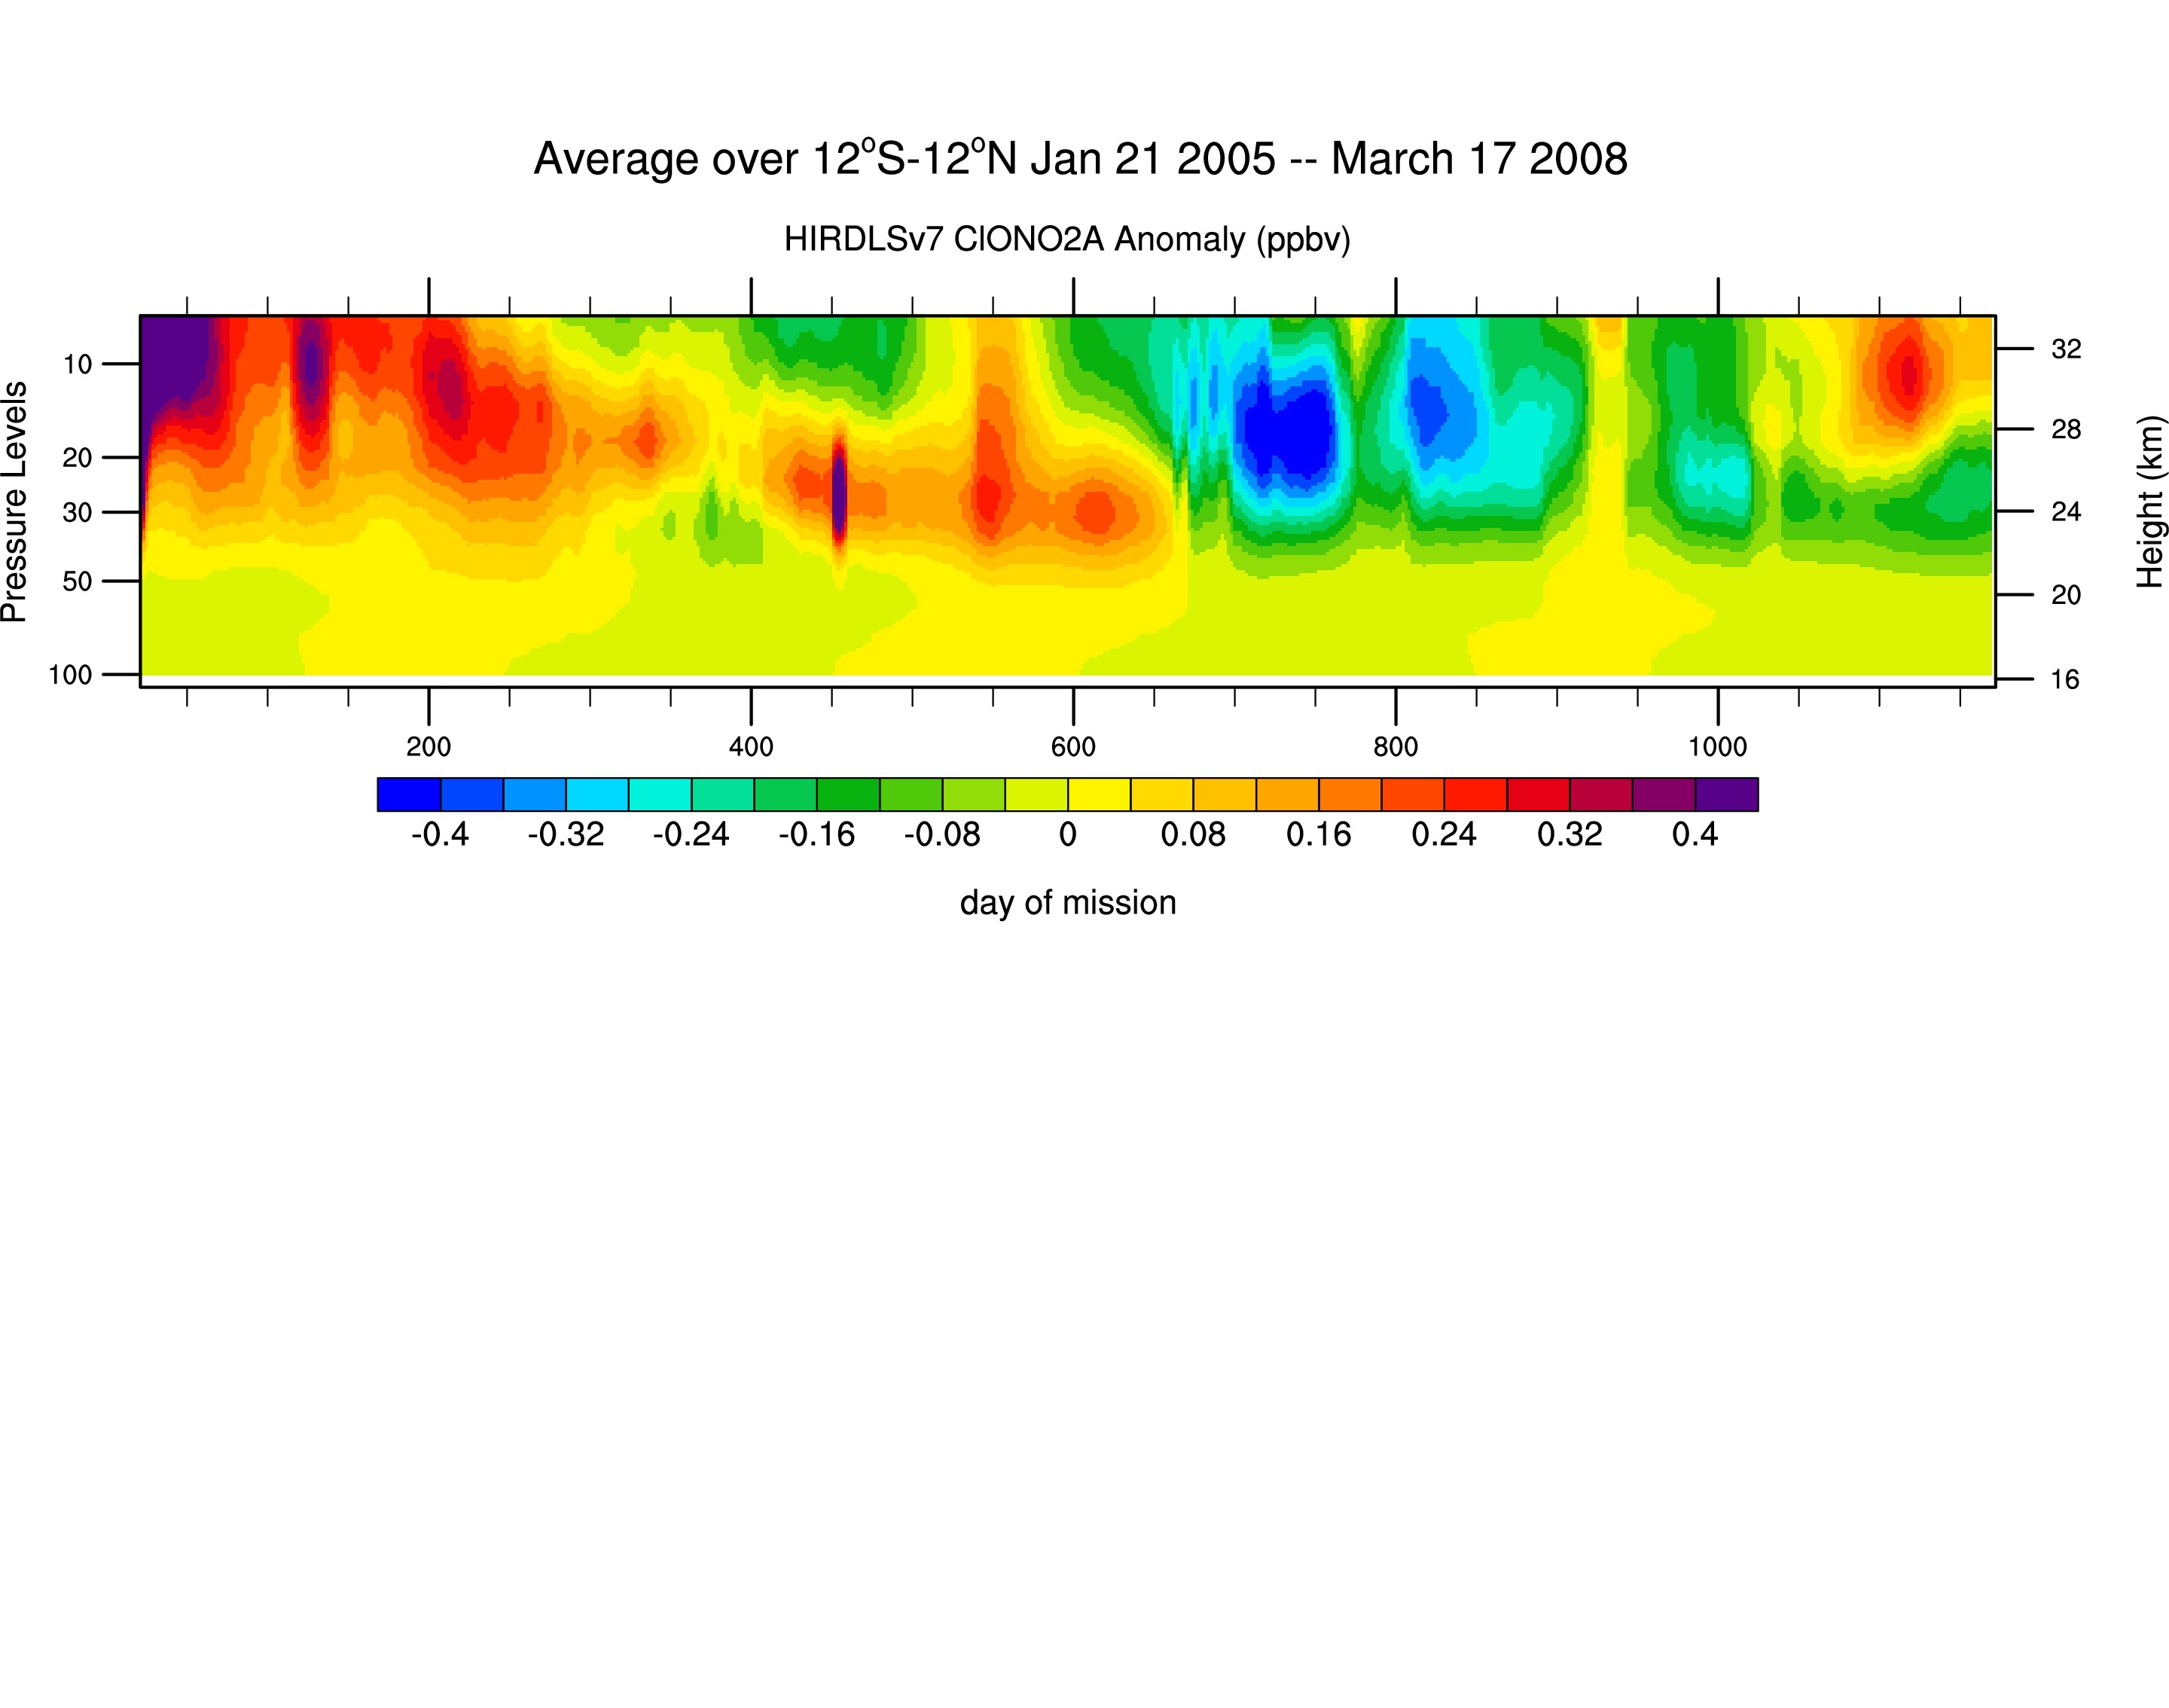
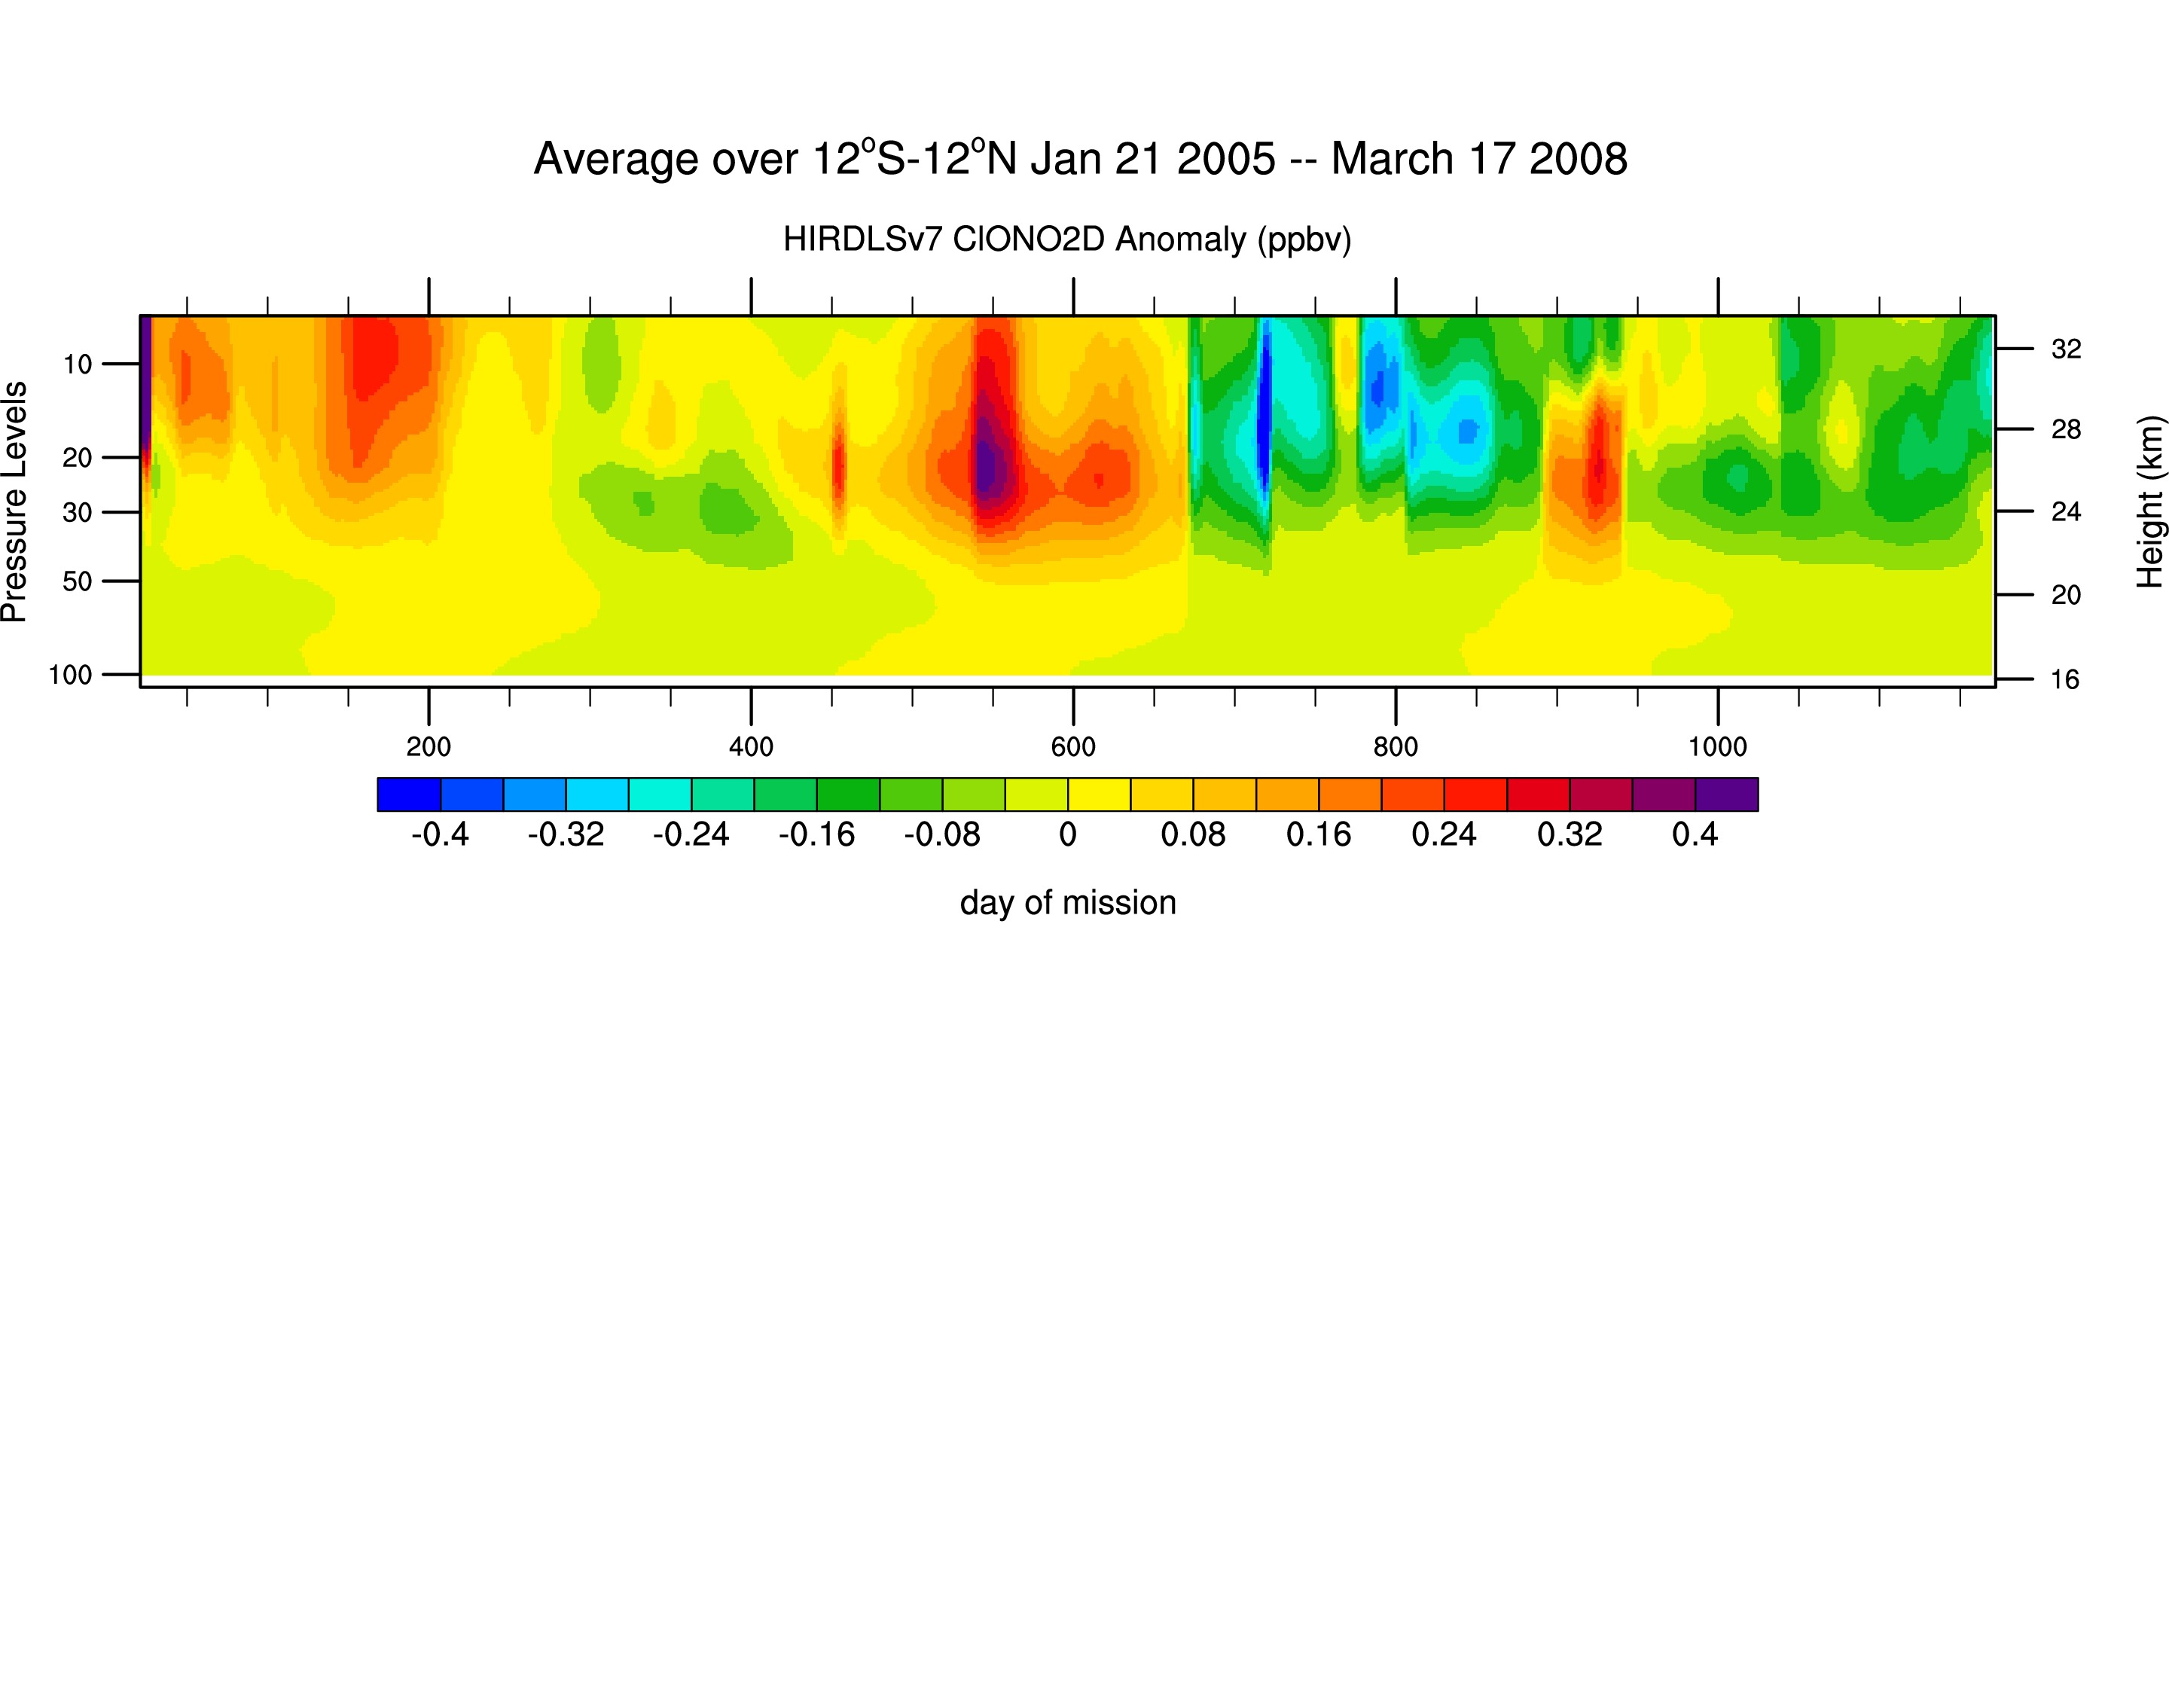
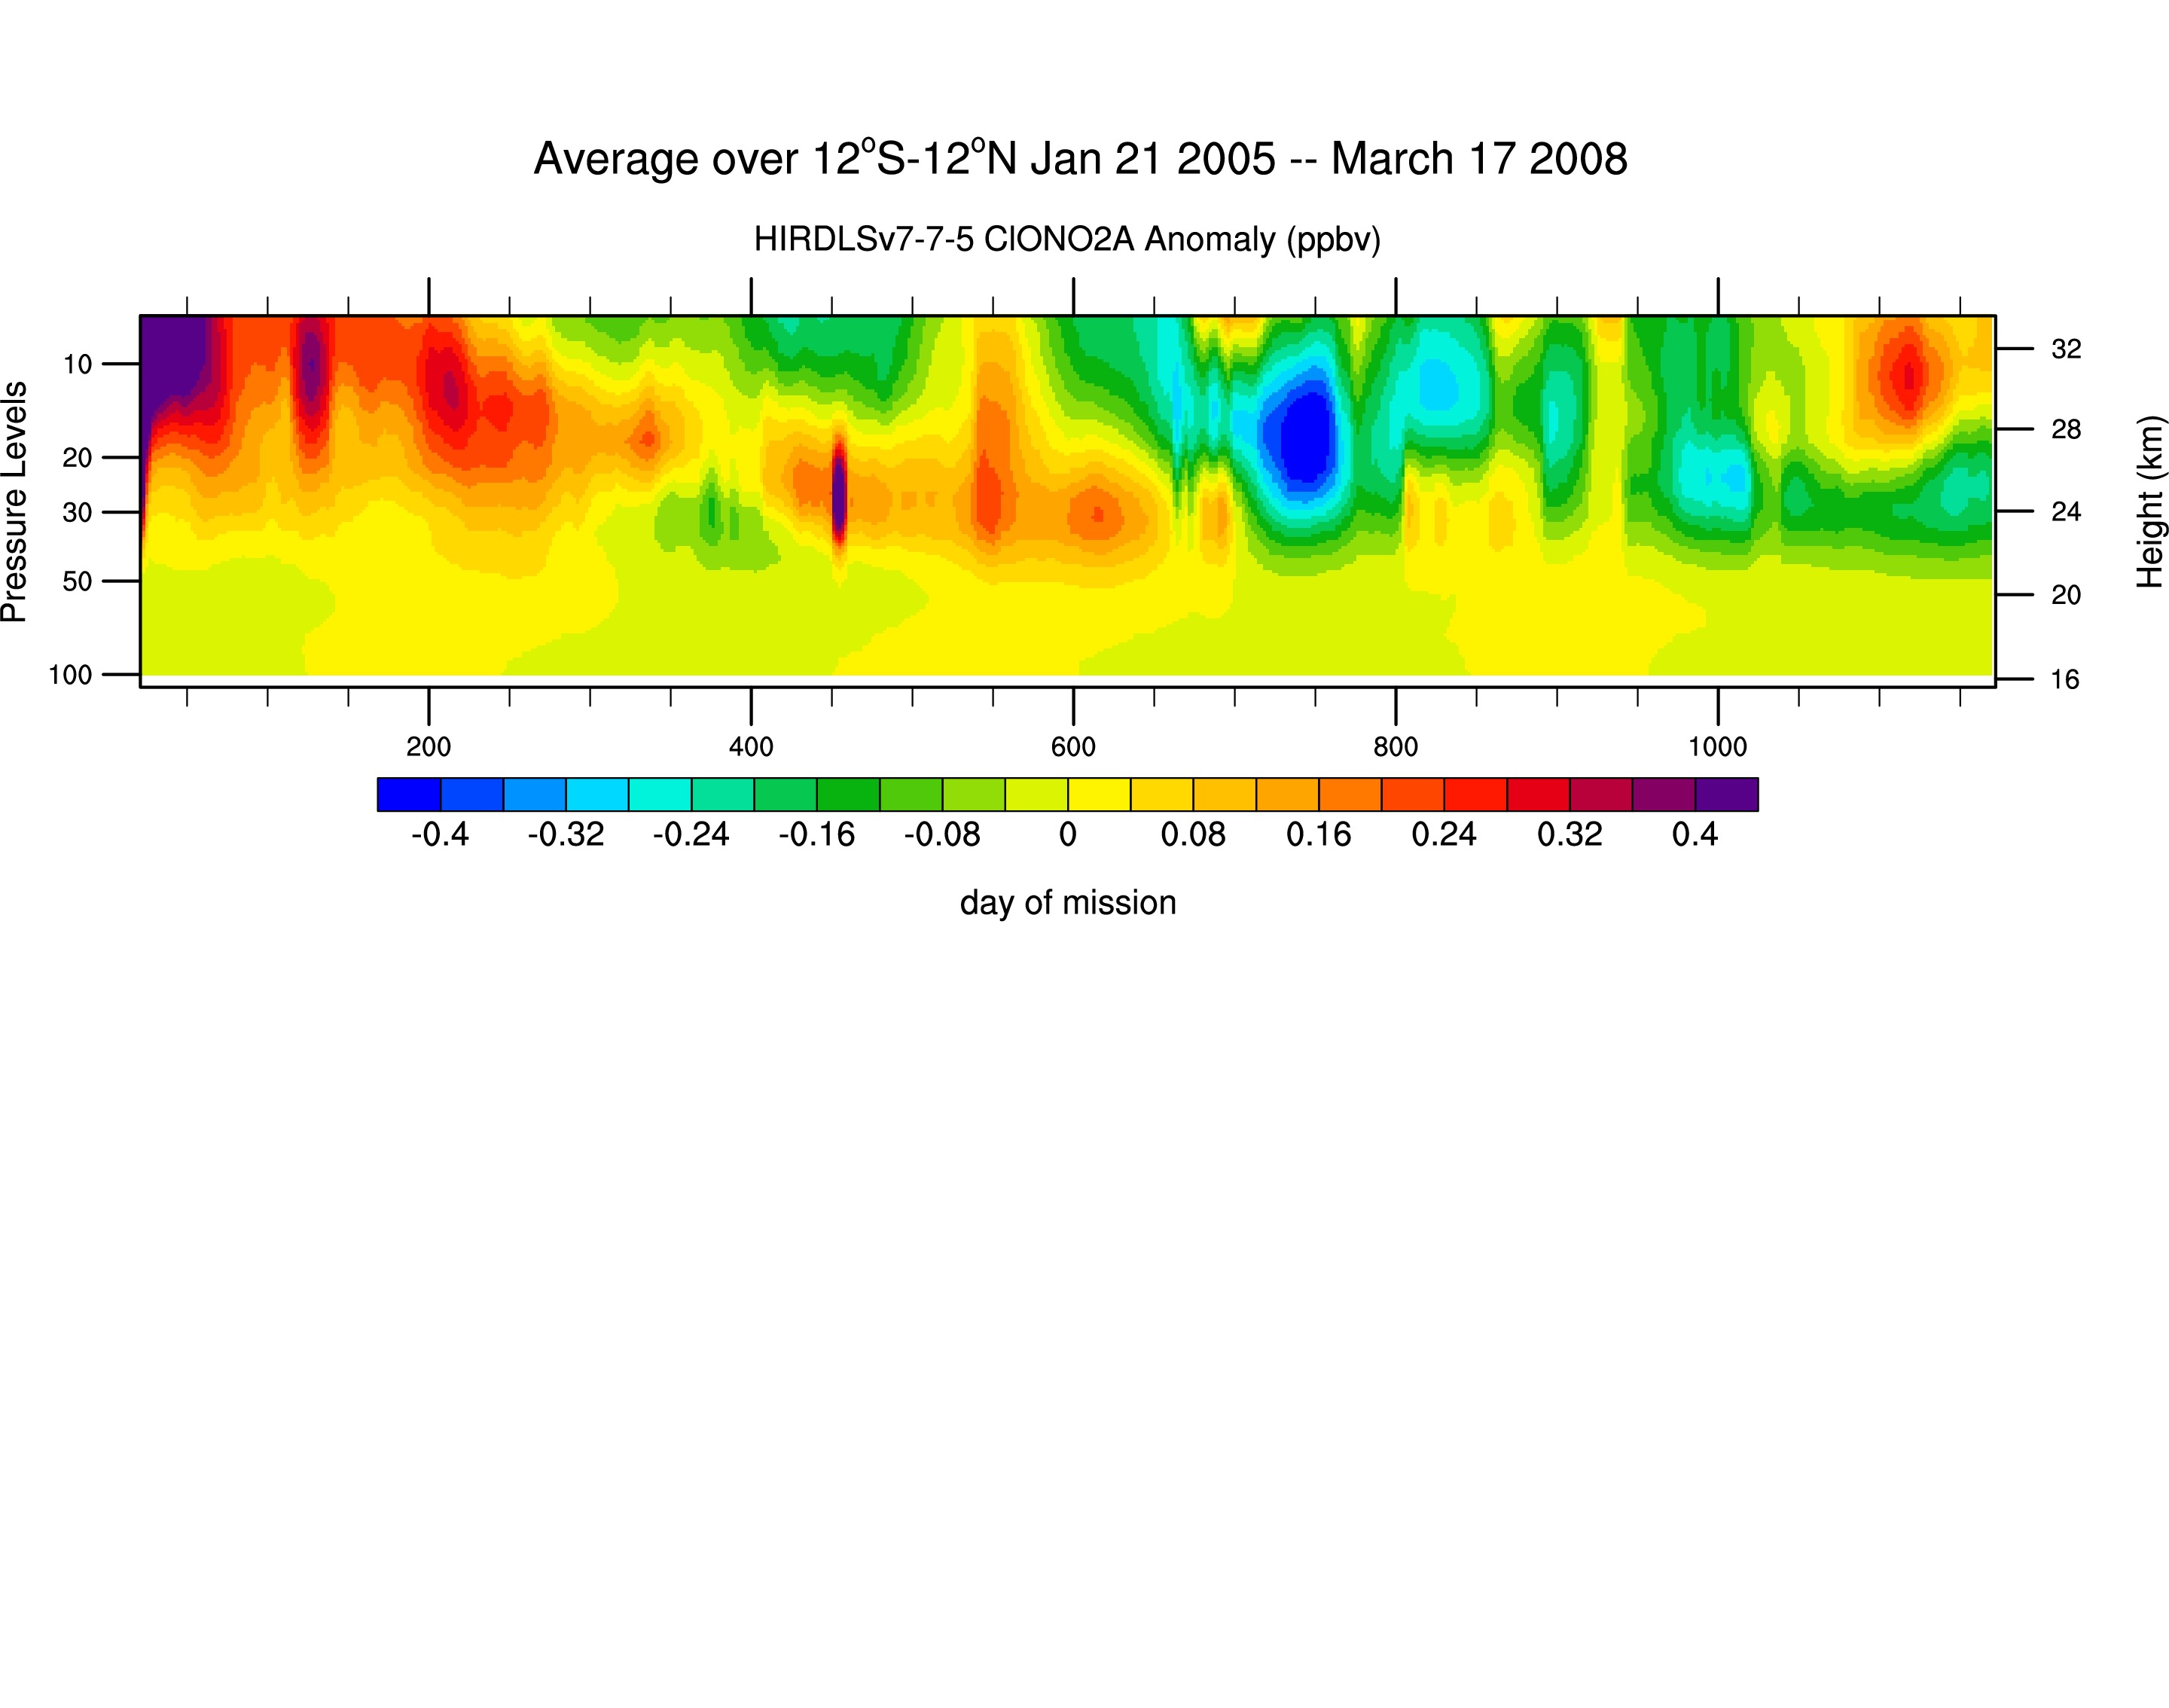
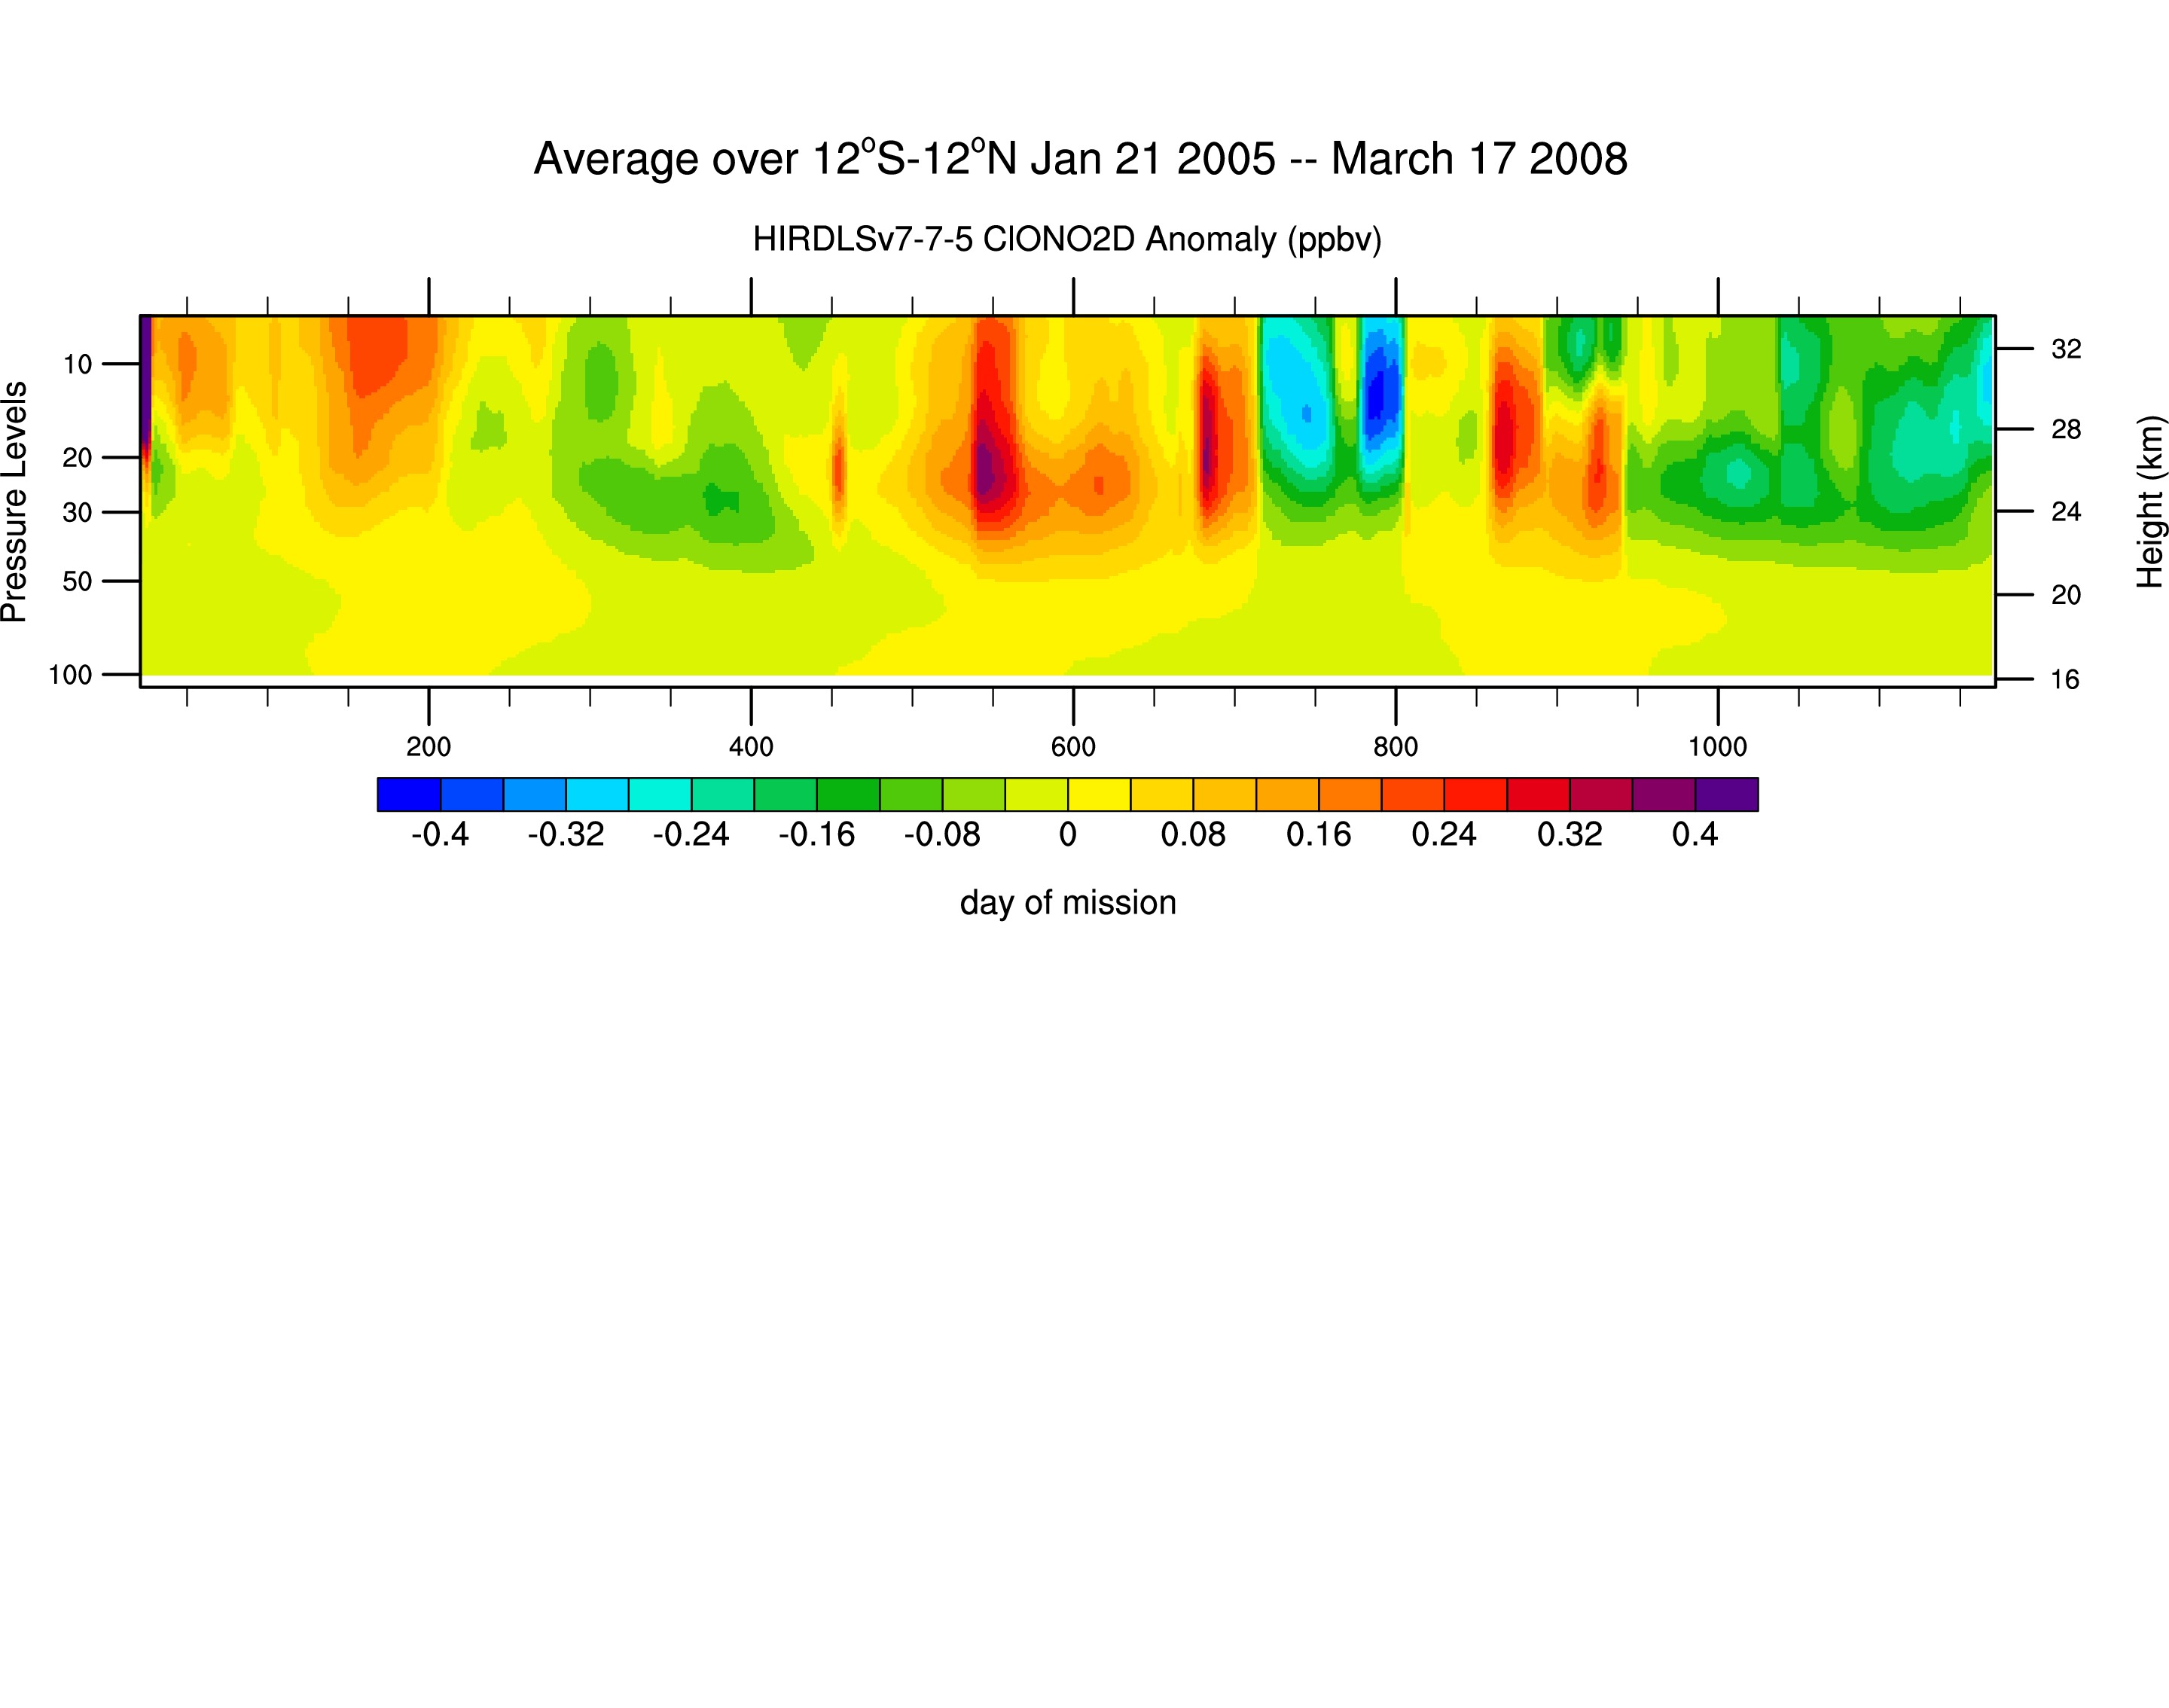
Height v. Time contour plots of global average HIRDLS V.7 data
January 21, 2005 -- March 17, 2008
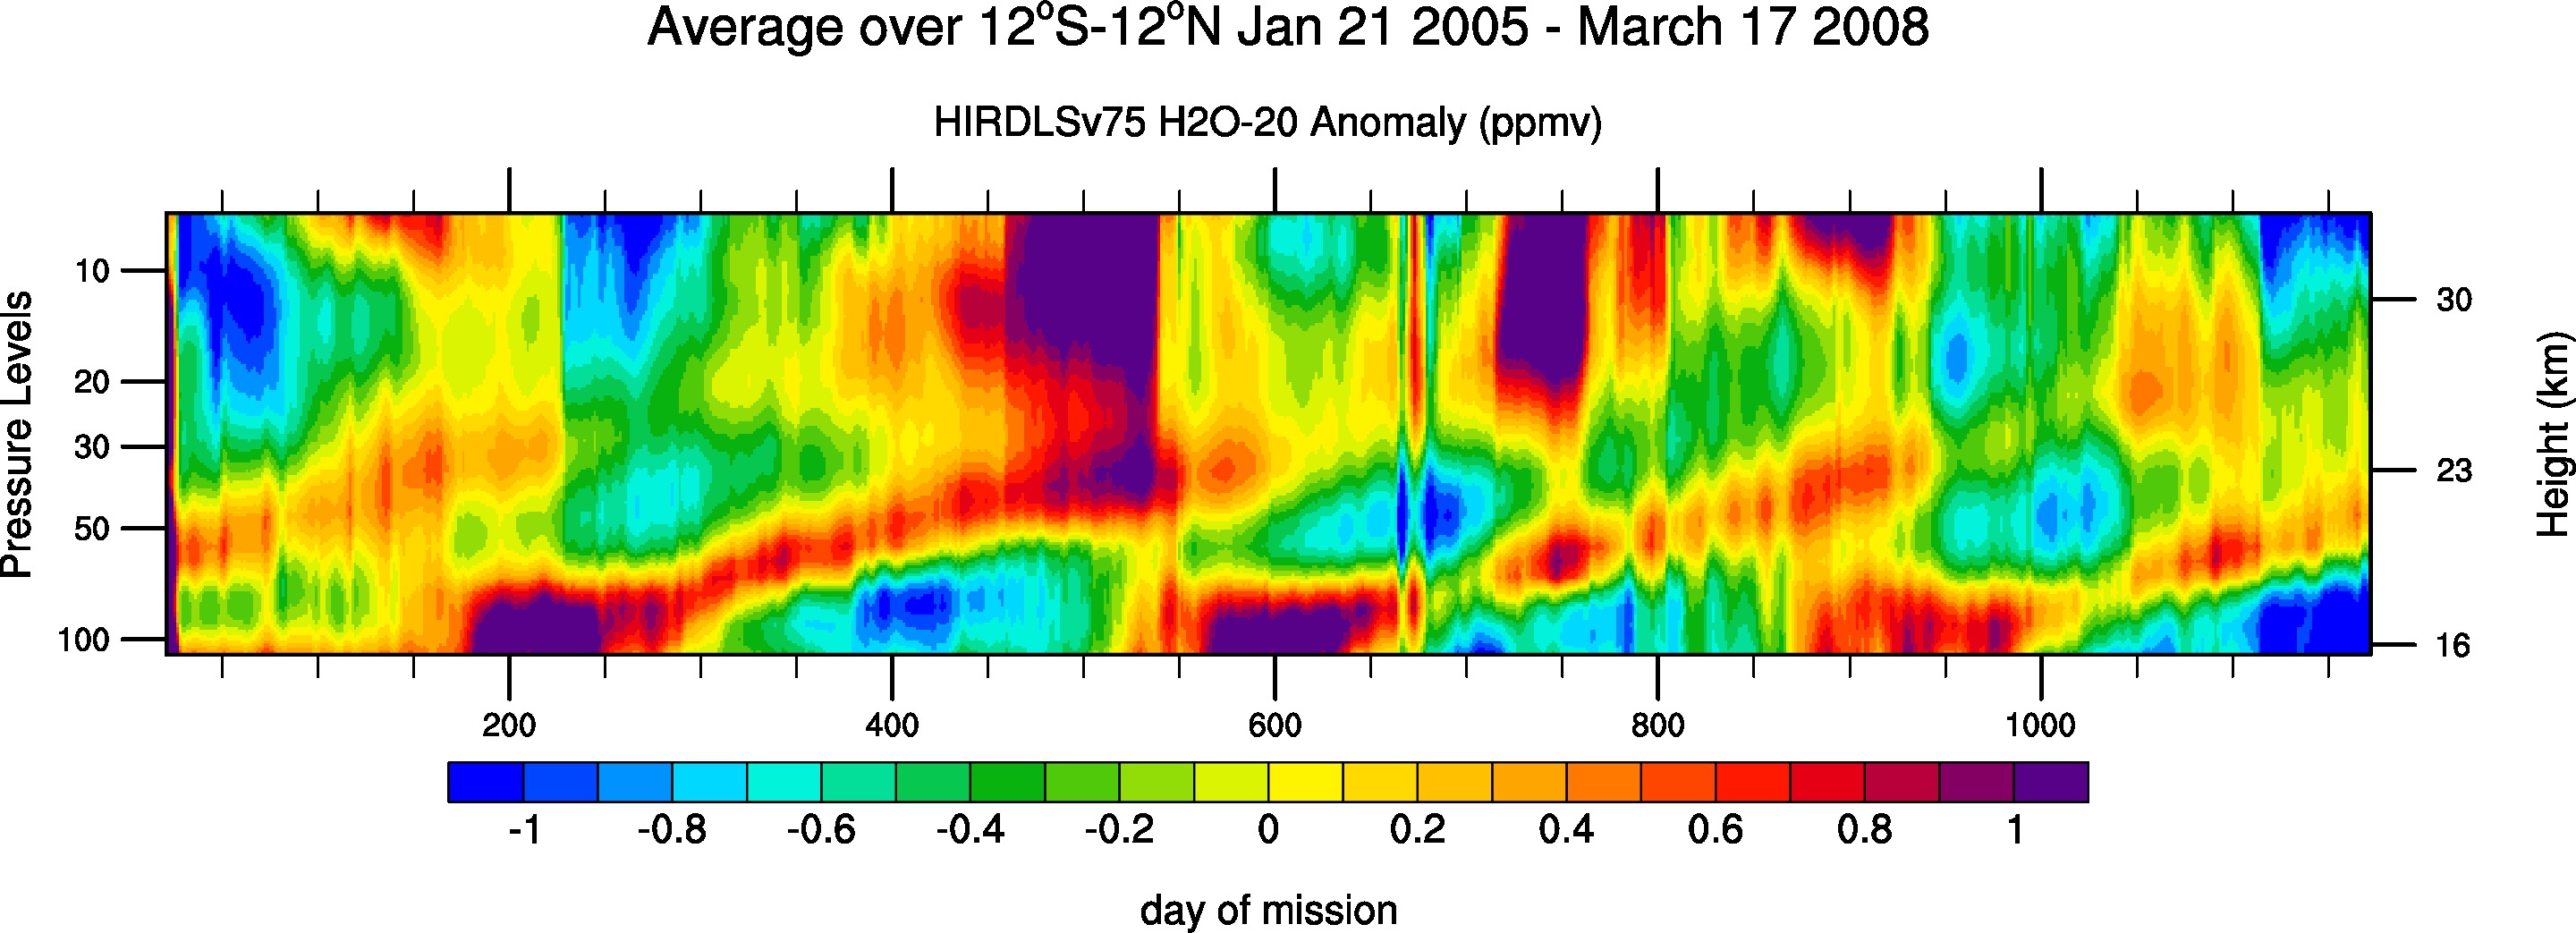
Test Height v. Time contour plots of global average HIRDLS V.7-00-05 data
January 21, 2005 -- March 17, 2008
- CFC11: gif
CFC12: gif
- GPH: gif
- H2O: gif, H2O-20: jpg
- HNO3 : gif
- N2O: gif
- NO2 : Combined (gif),Ascending (jpg), Descending (jpg)
- O3: gif
- Temp.: gif
- ClONO2: c01: up & down scans:Combined (jpg),Ascending (jpg),Descending (jpg)
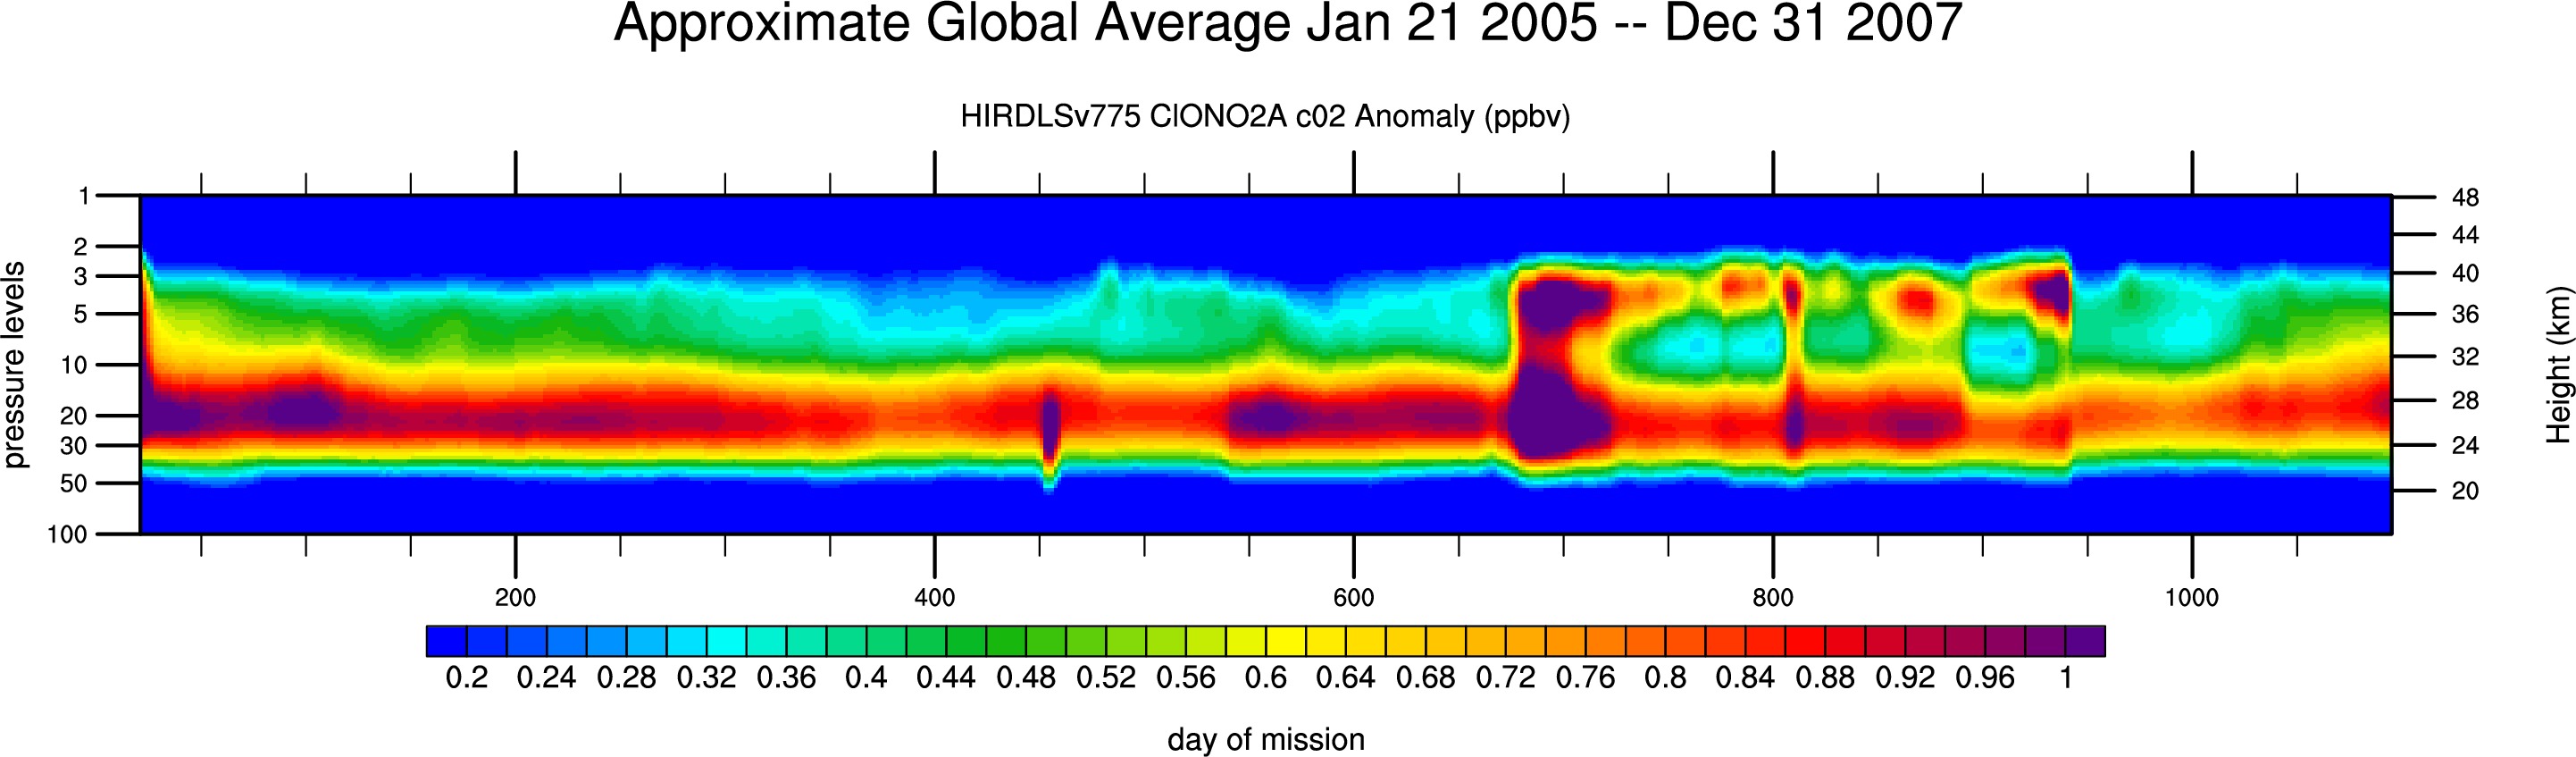
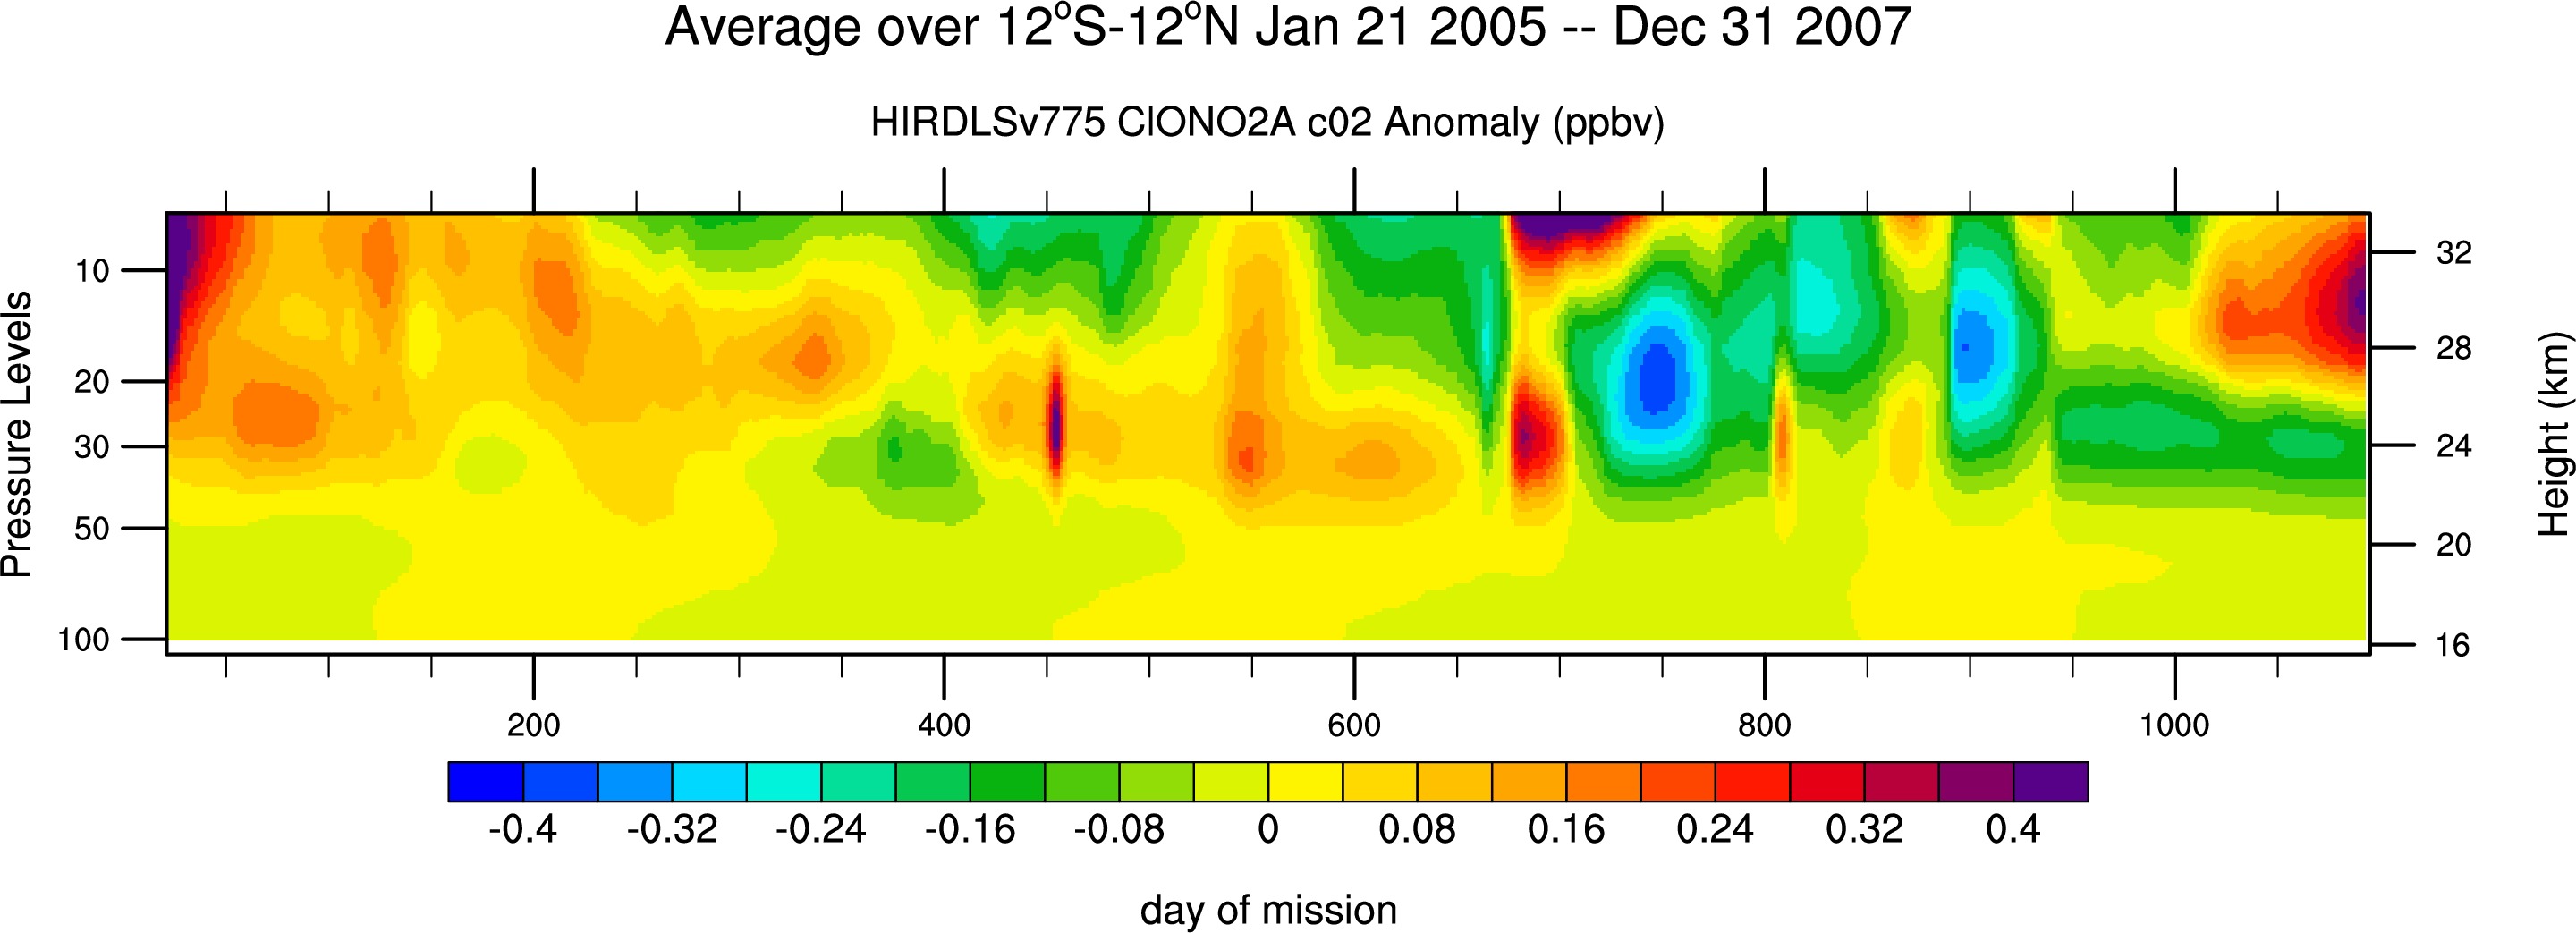
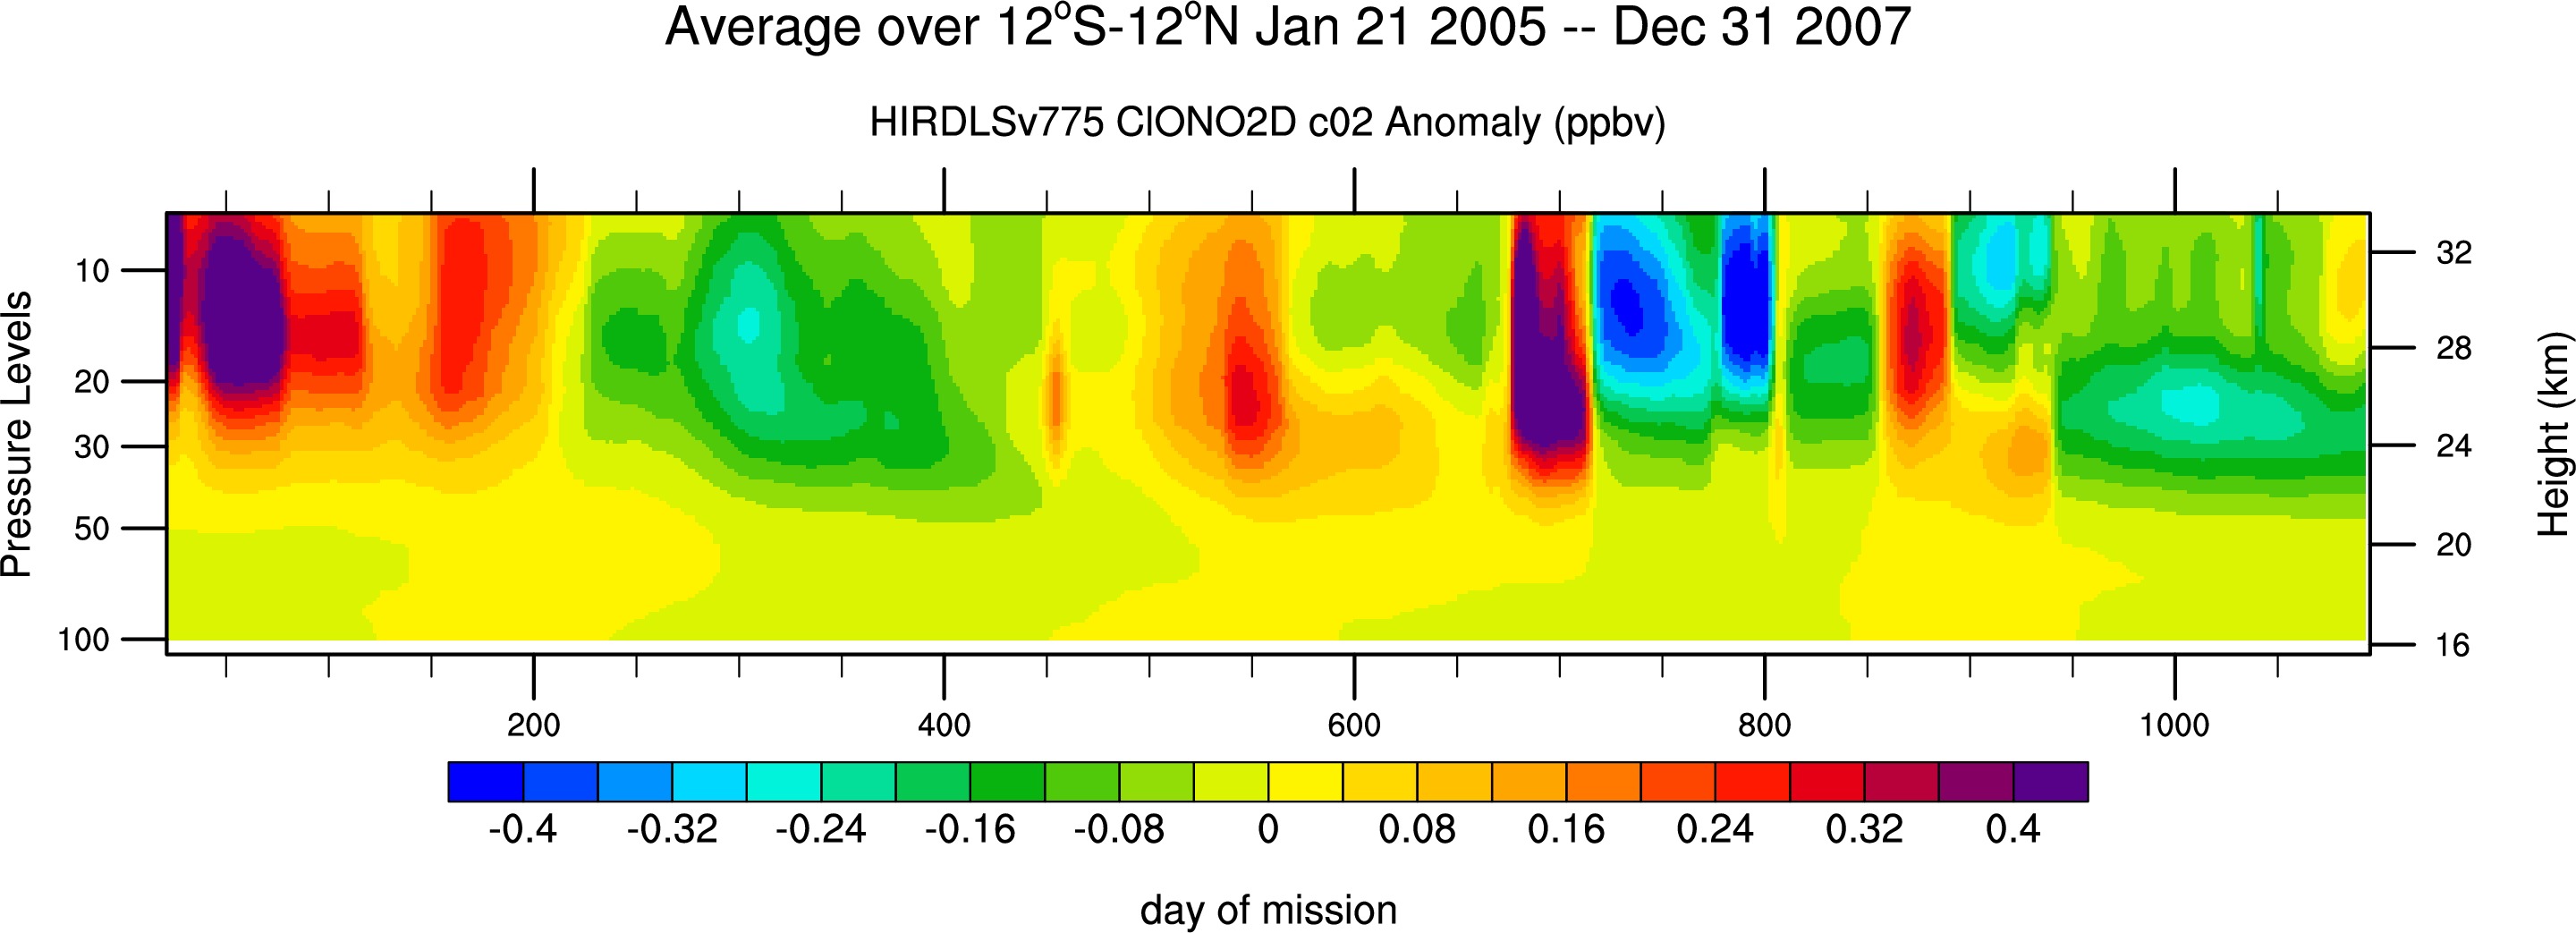
ClONO2: c02: up scans:Ascending (jpg),Descending (jpg)
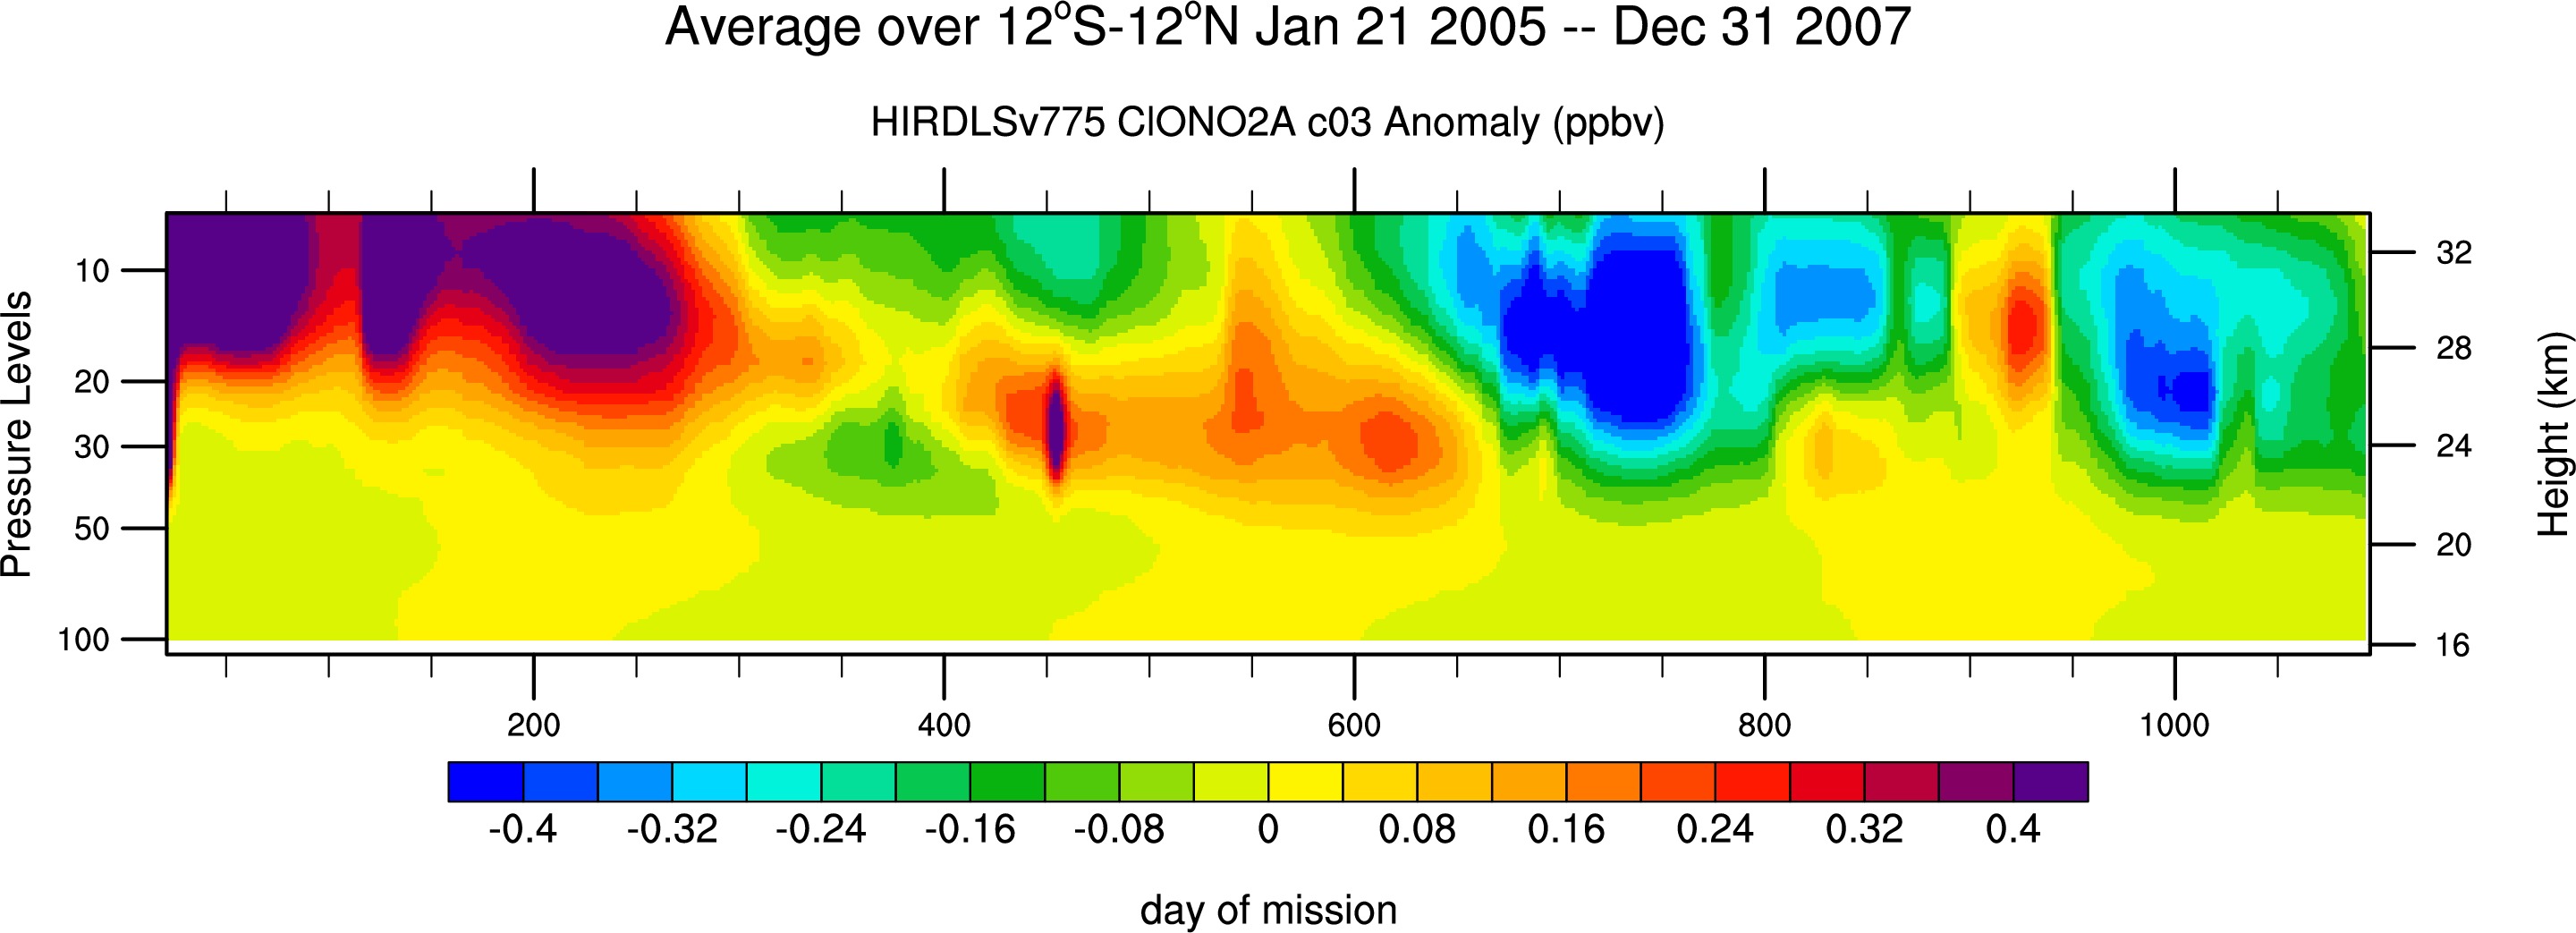
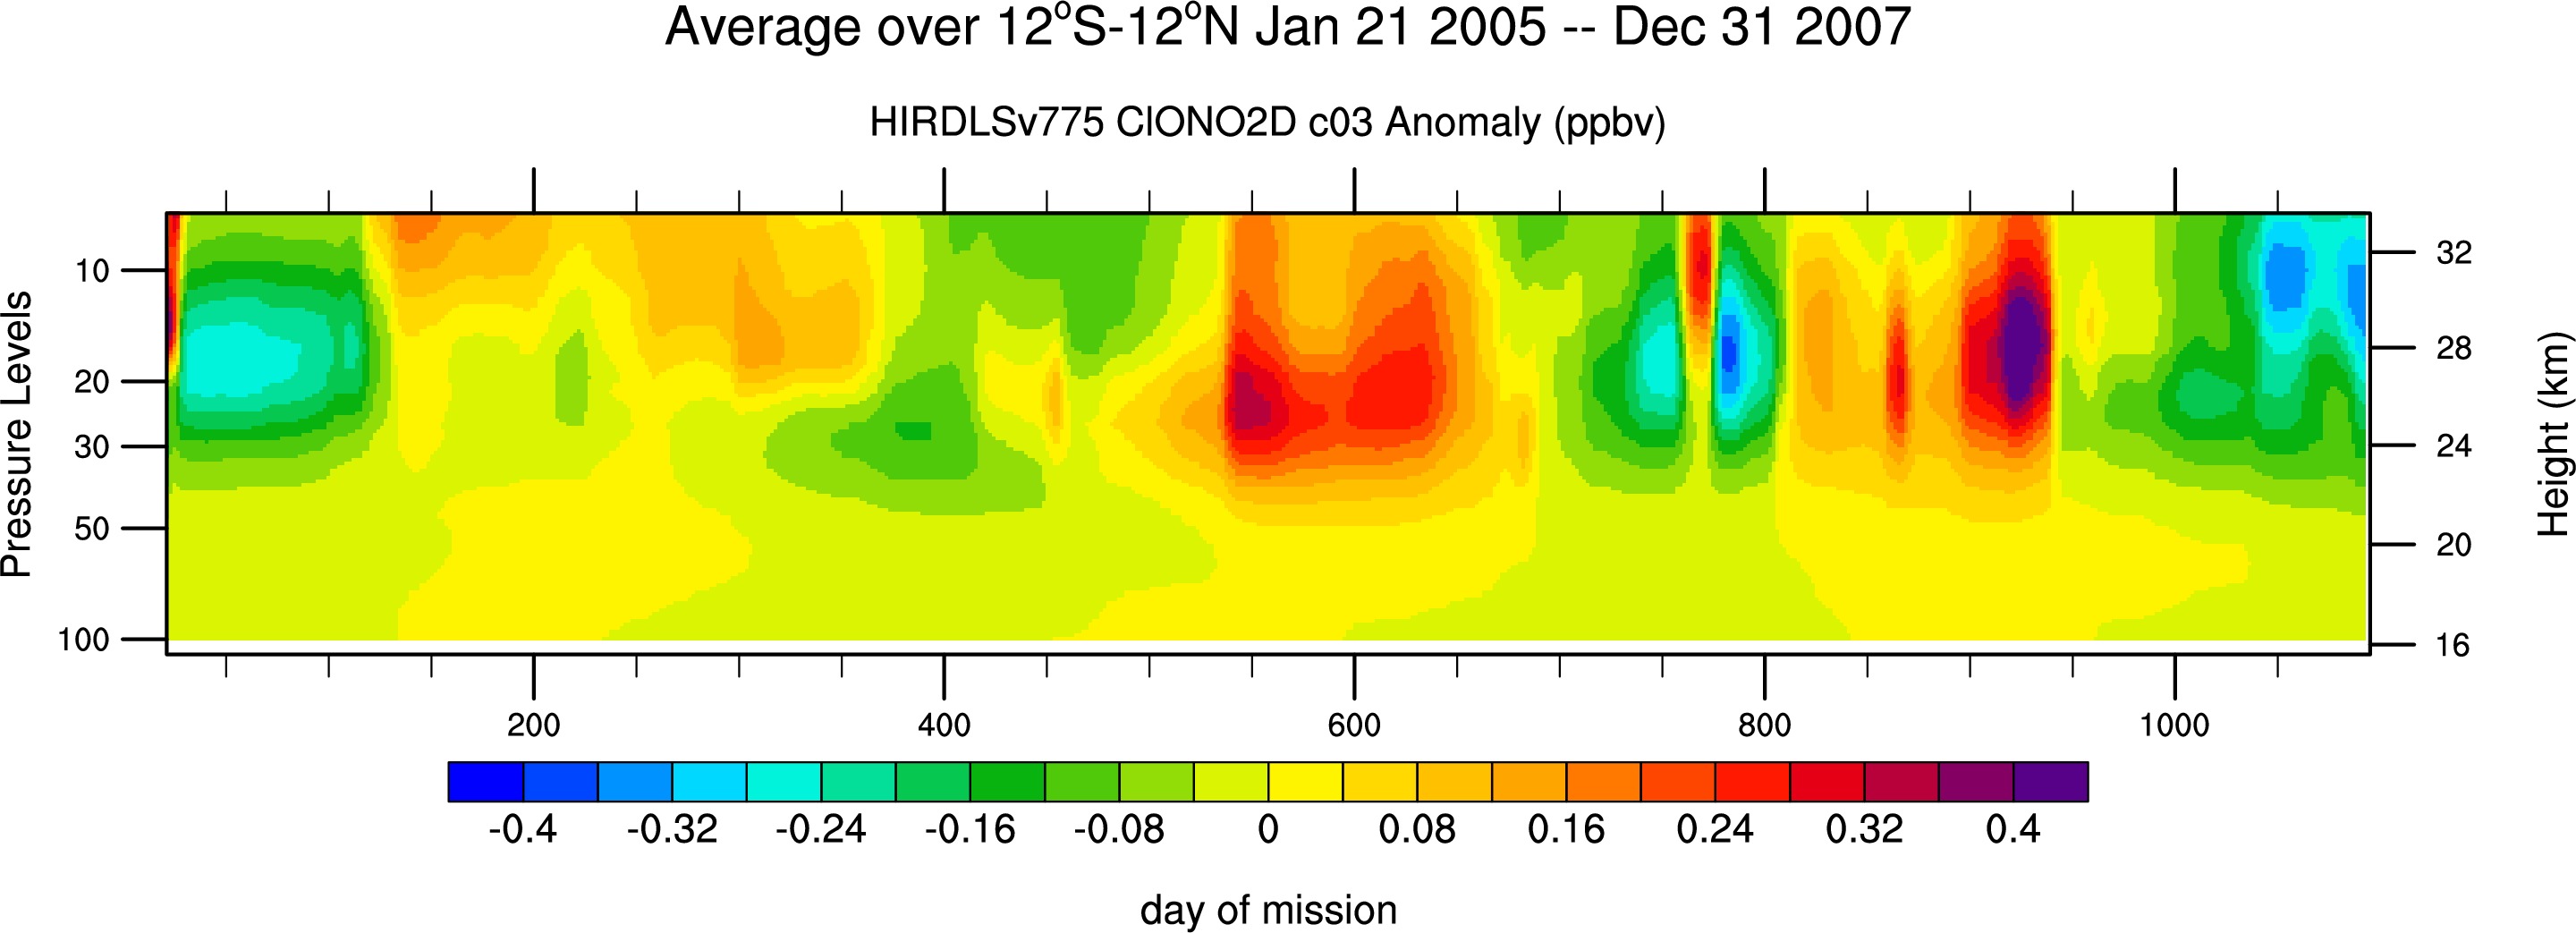
ClONO2: c03: down scans:Ascending (jpg),Descending (jpg)
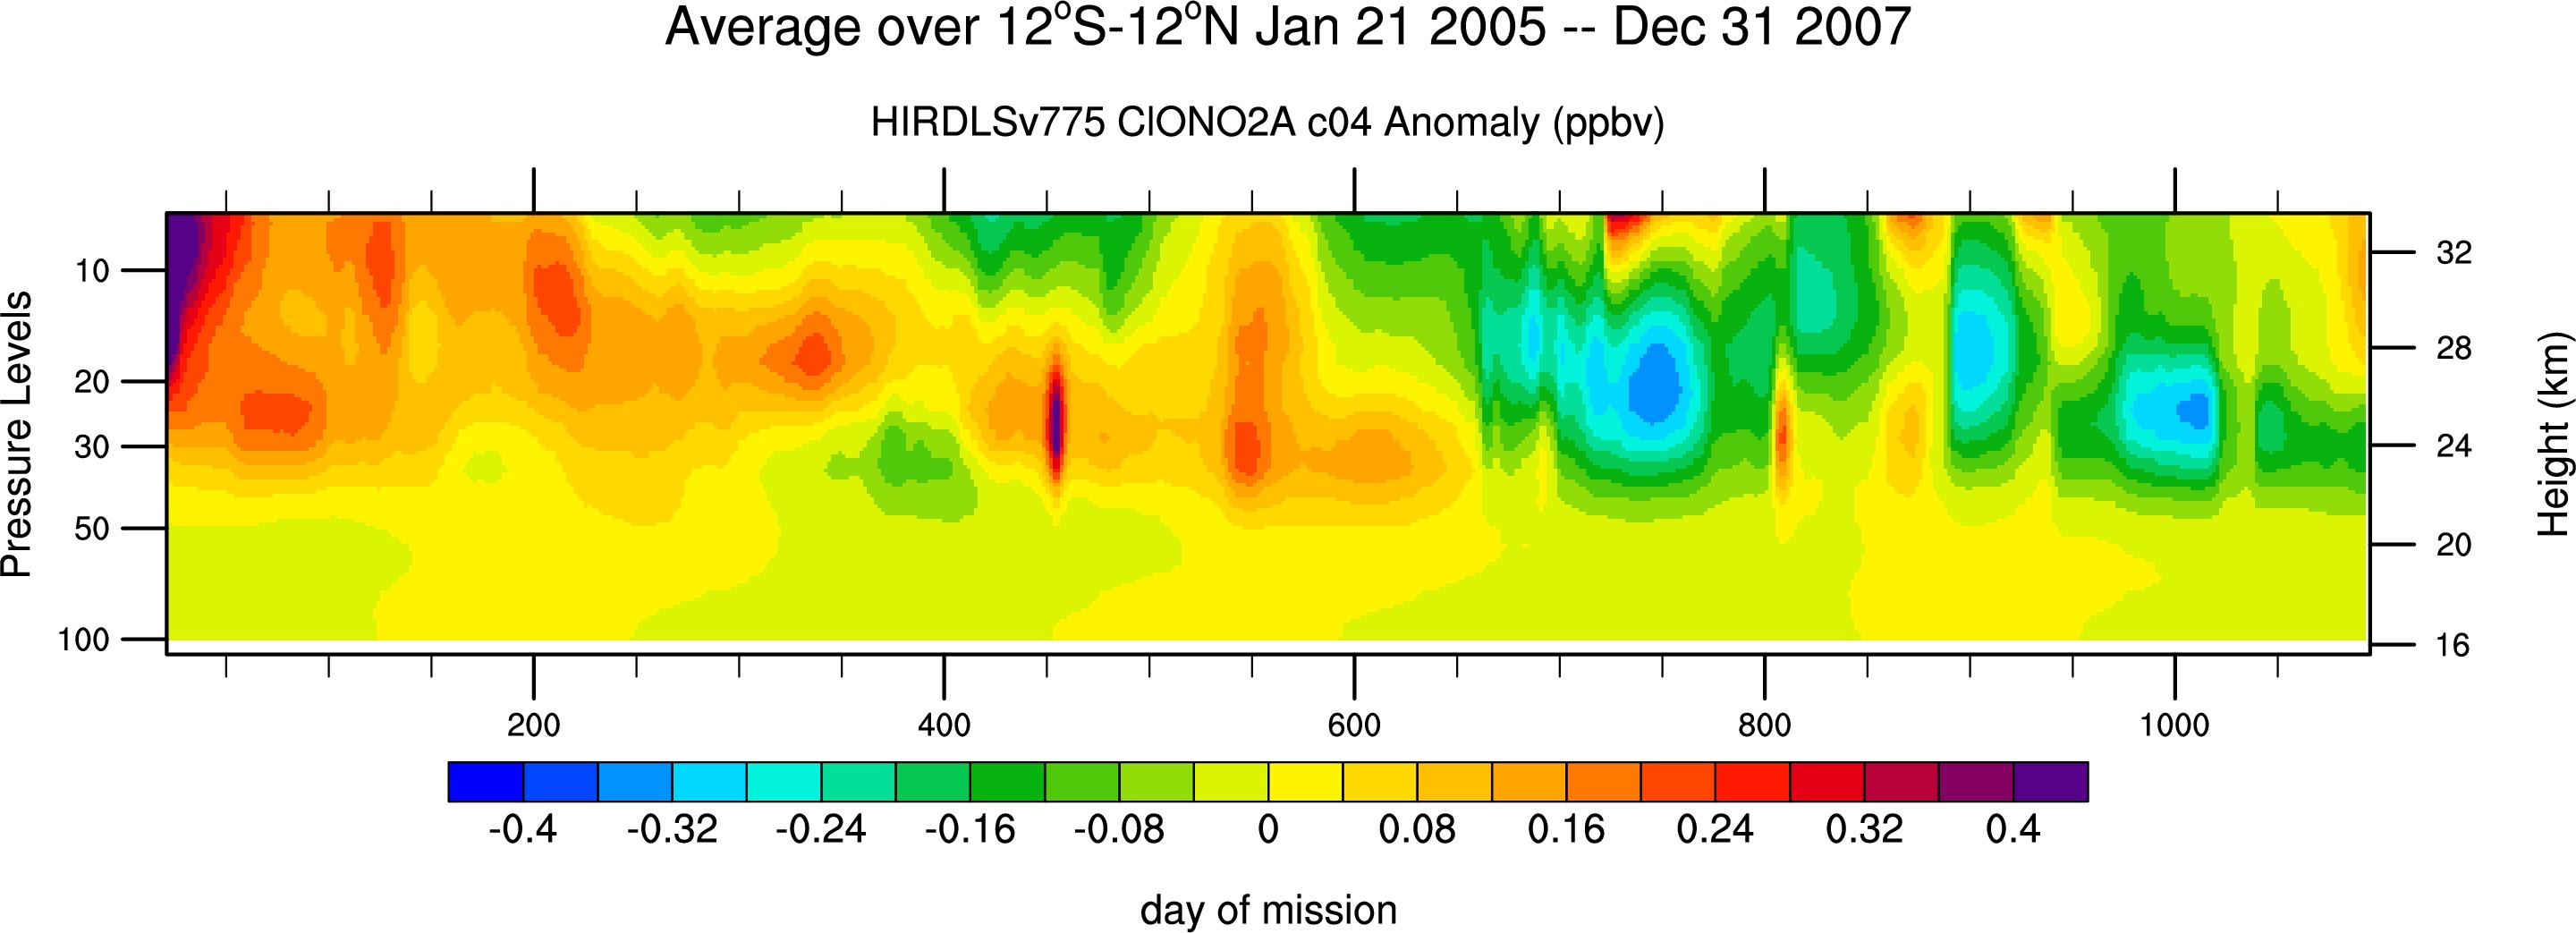
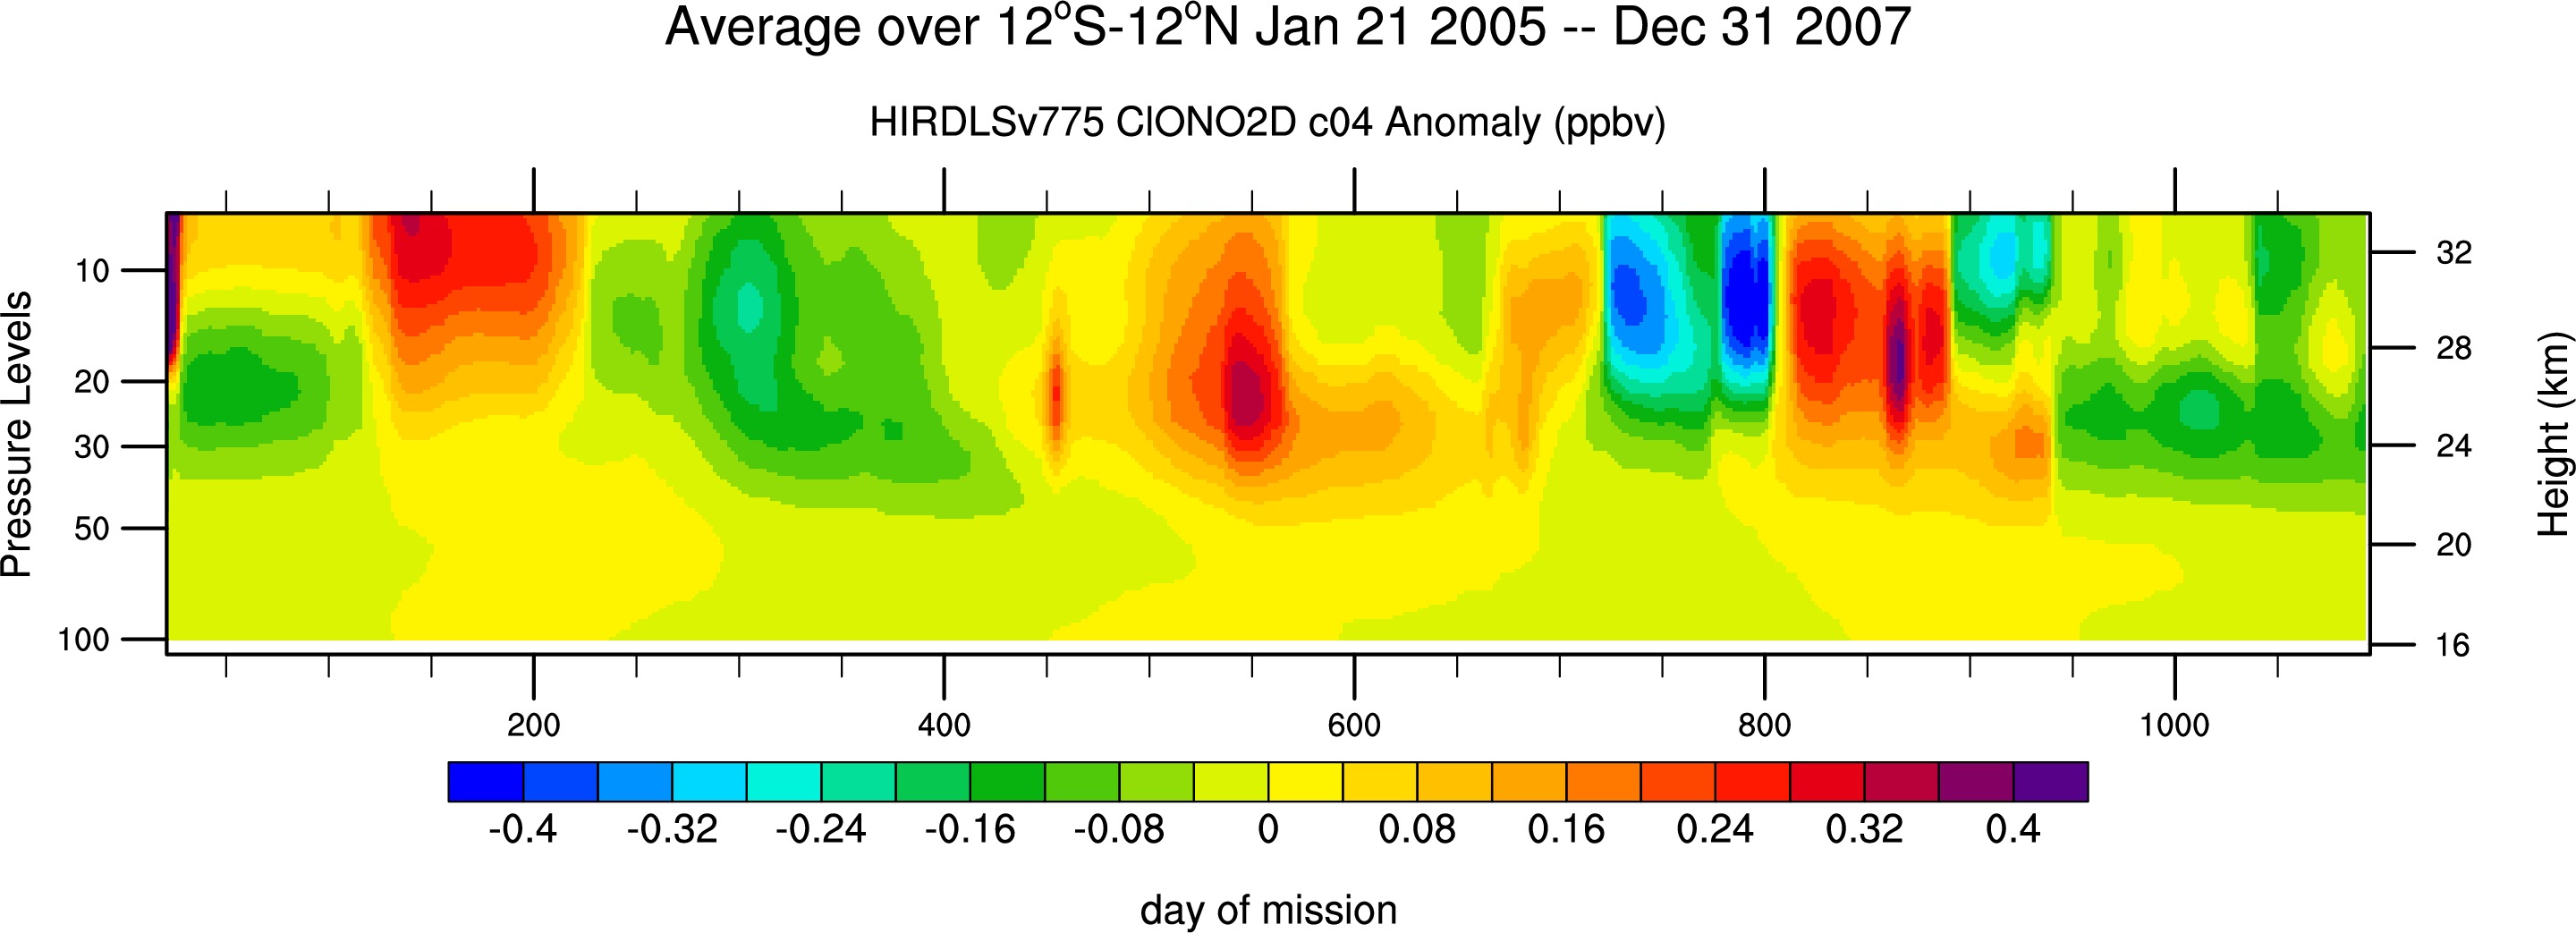
ClONO2: c04: mixed up & down scans:Ascending (jpg),Descending (jpg)
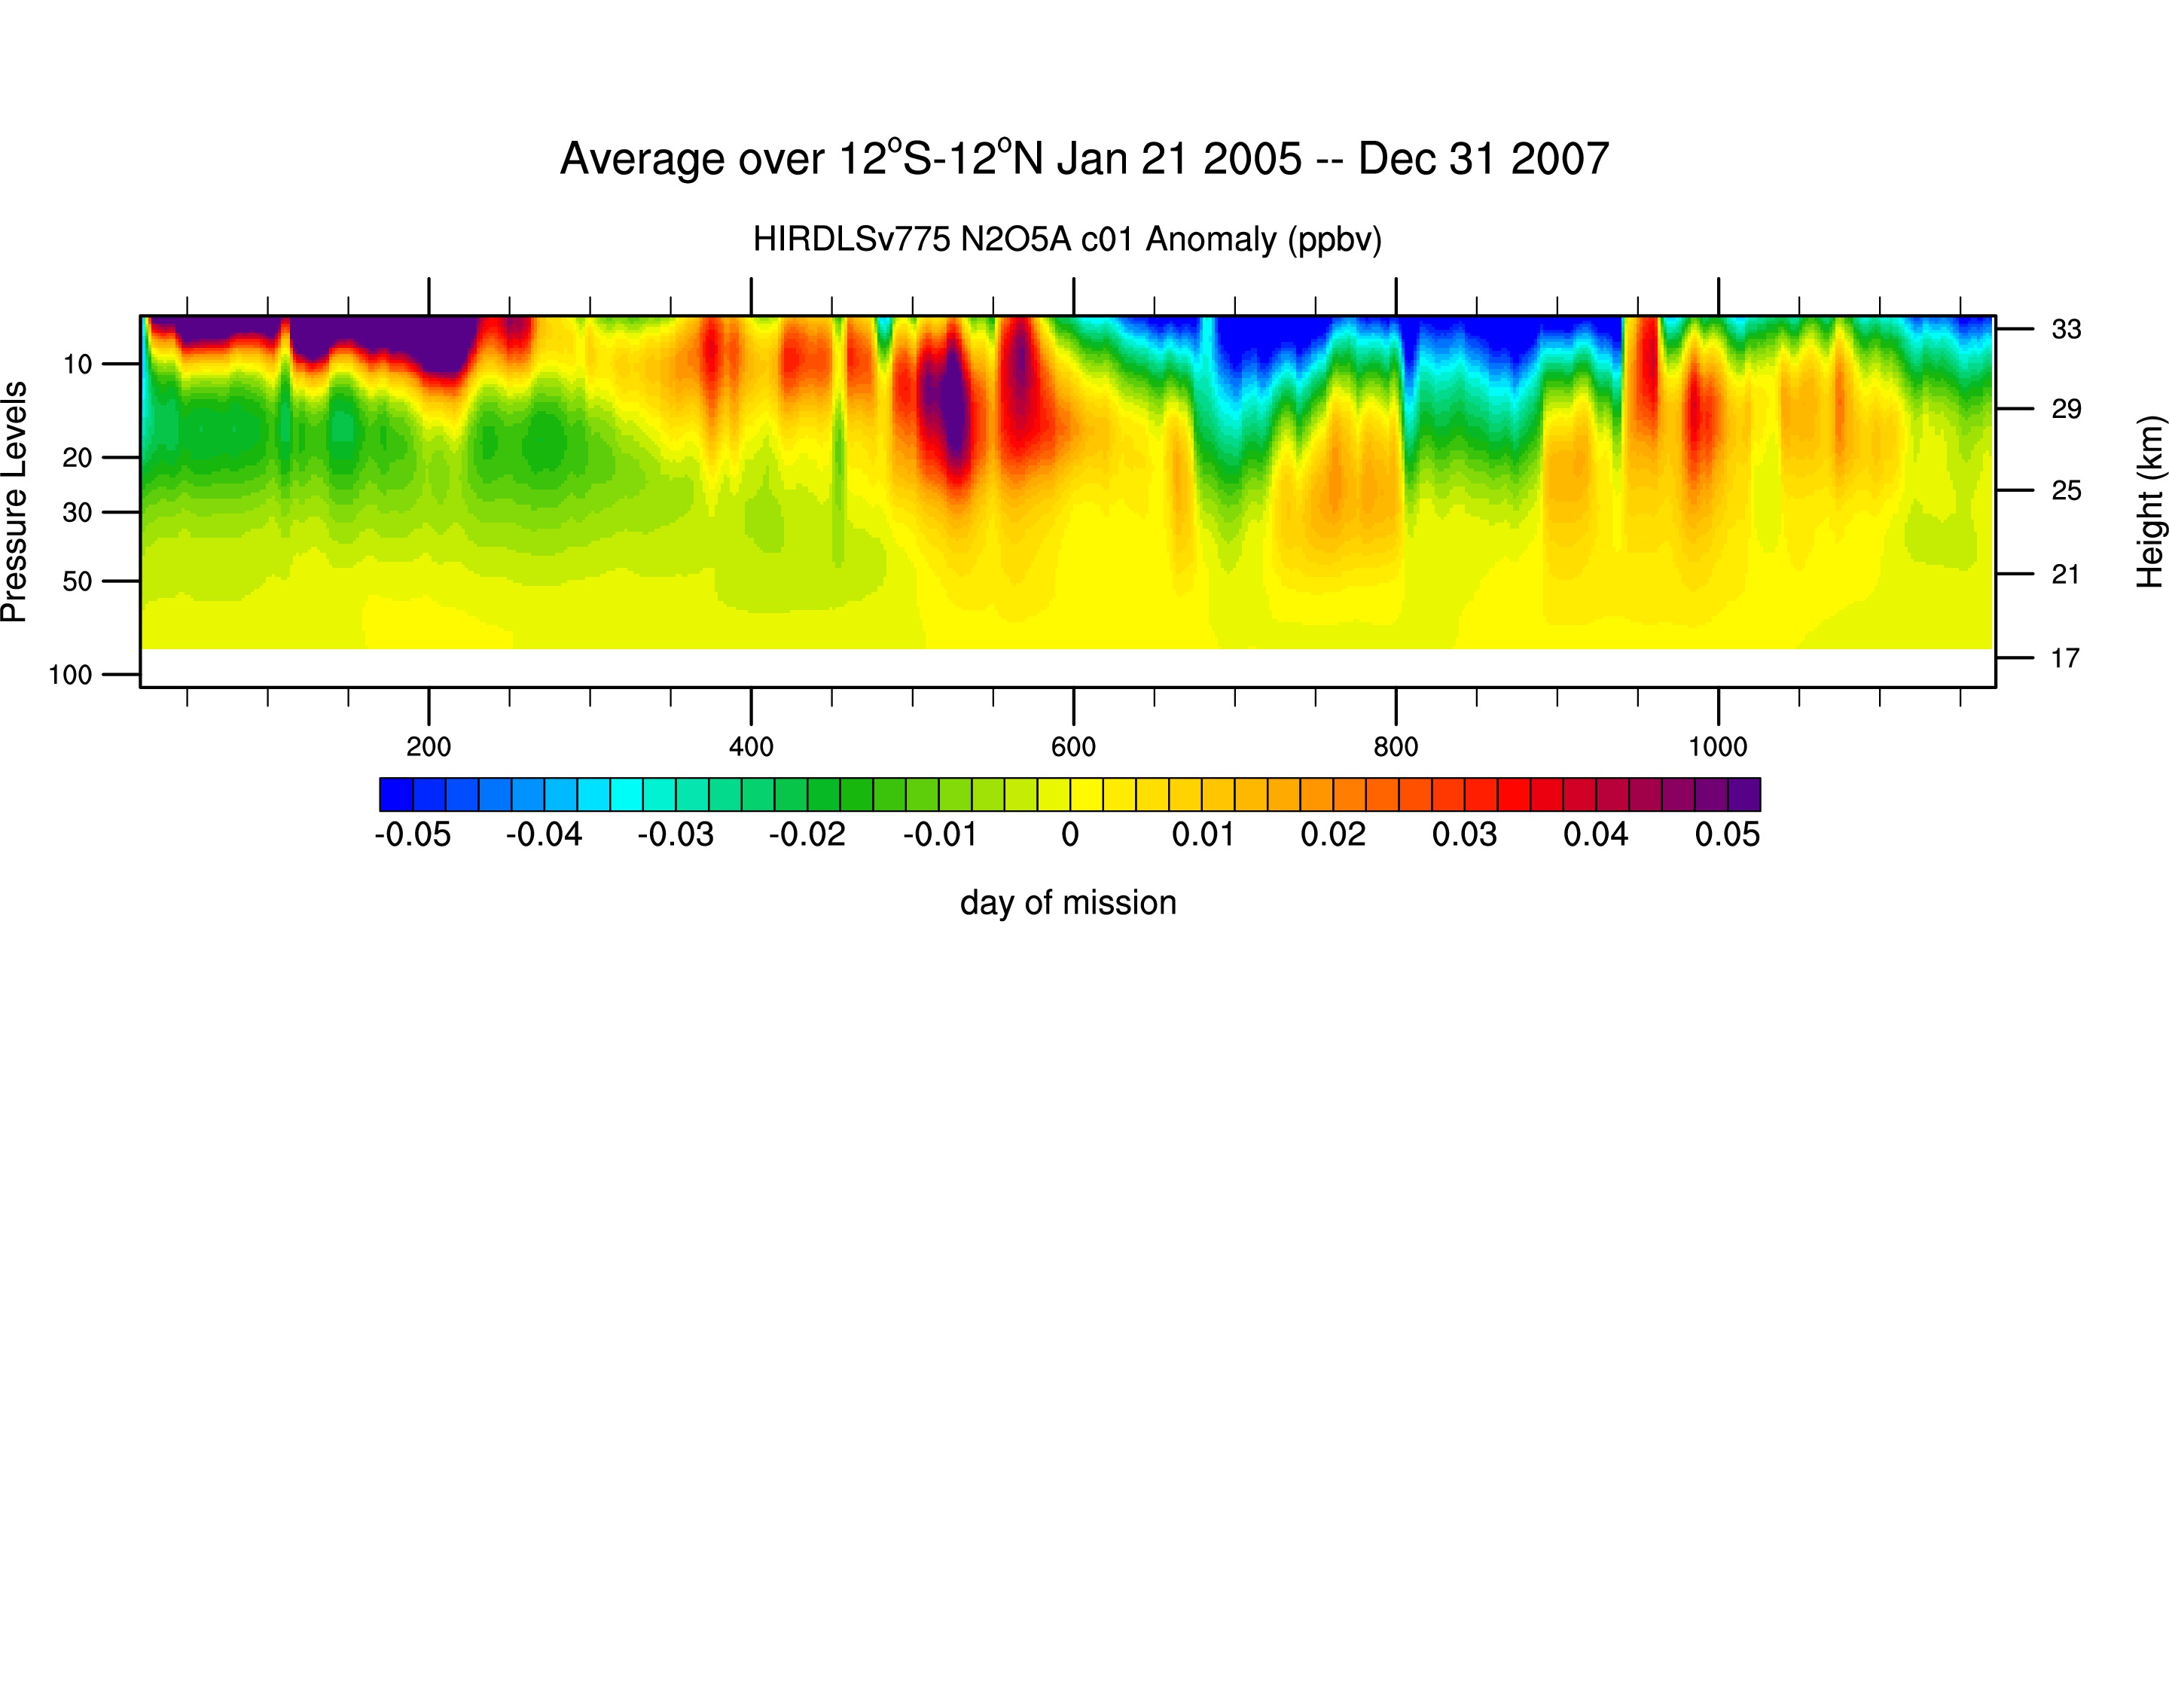
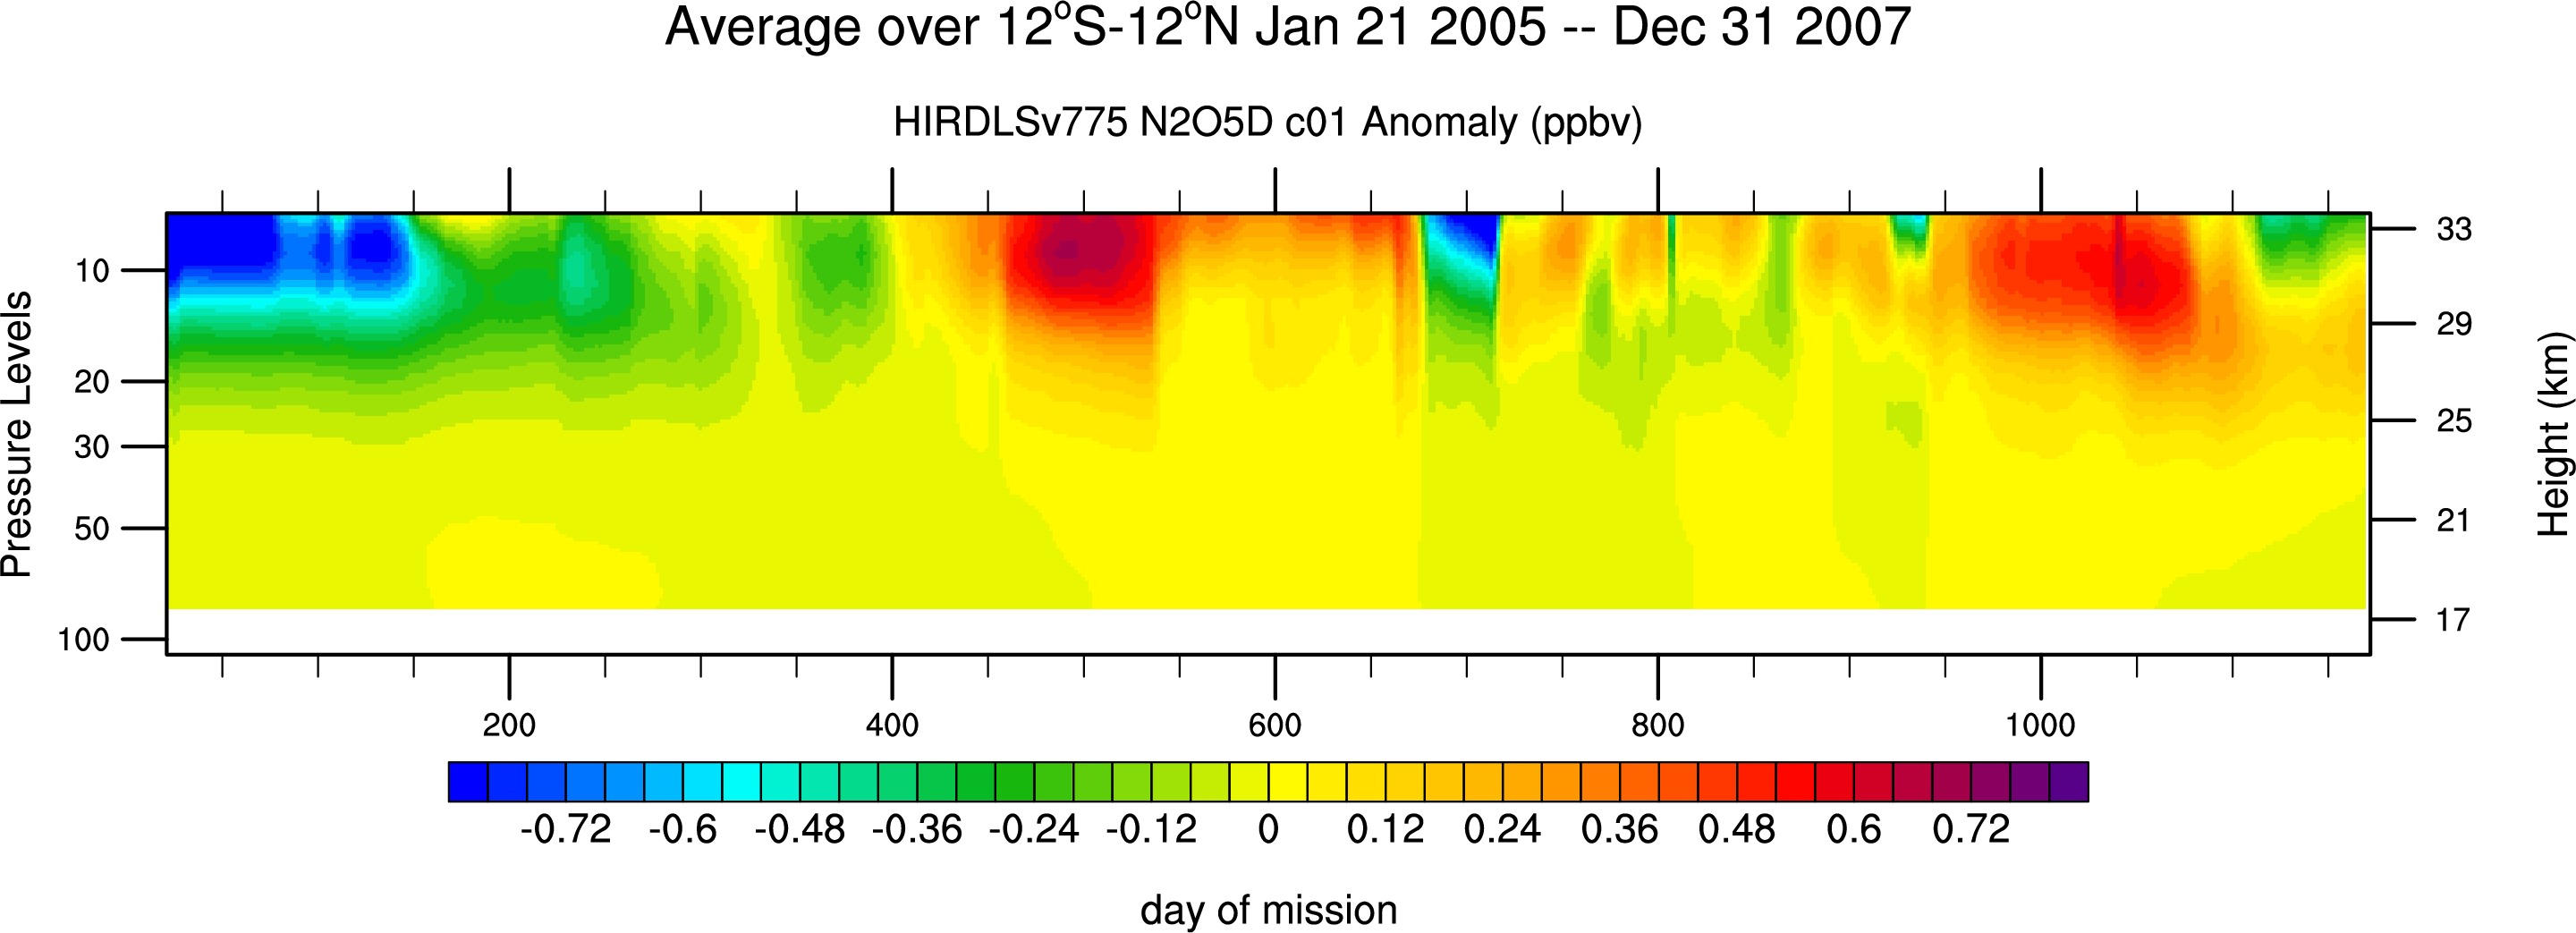
- N2O5: c01: up & down scans:Combined (gif),Ascending (jpg), Descending (jpg)
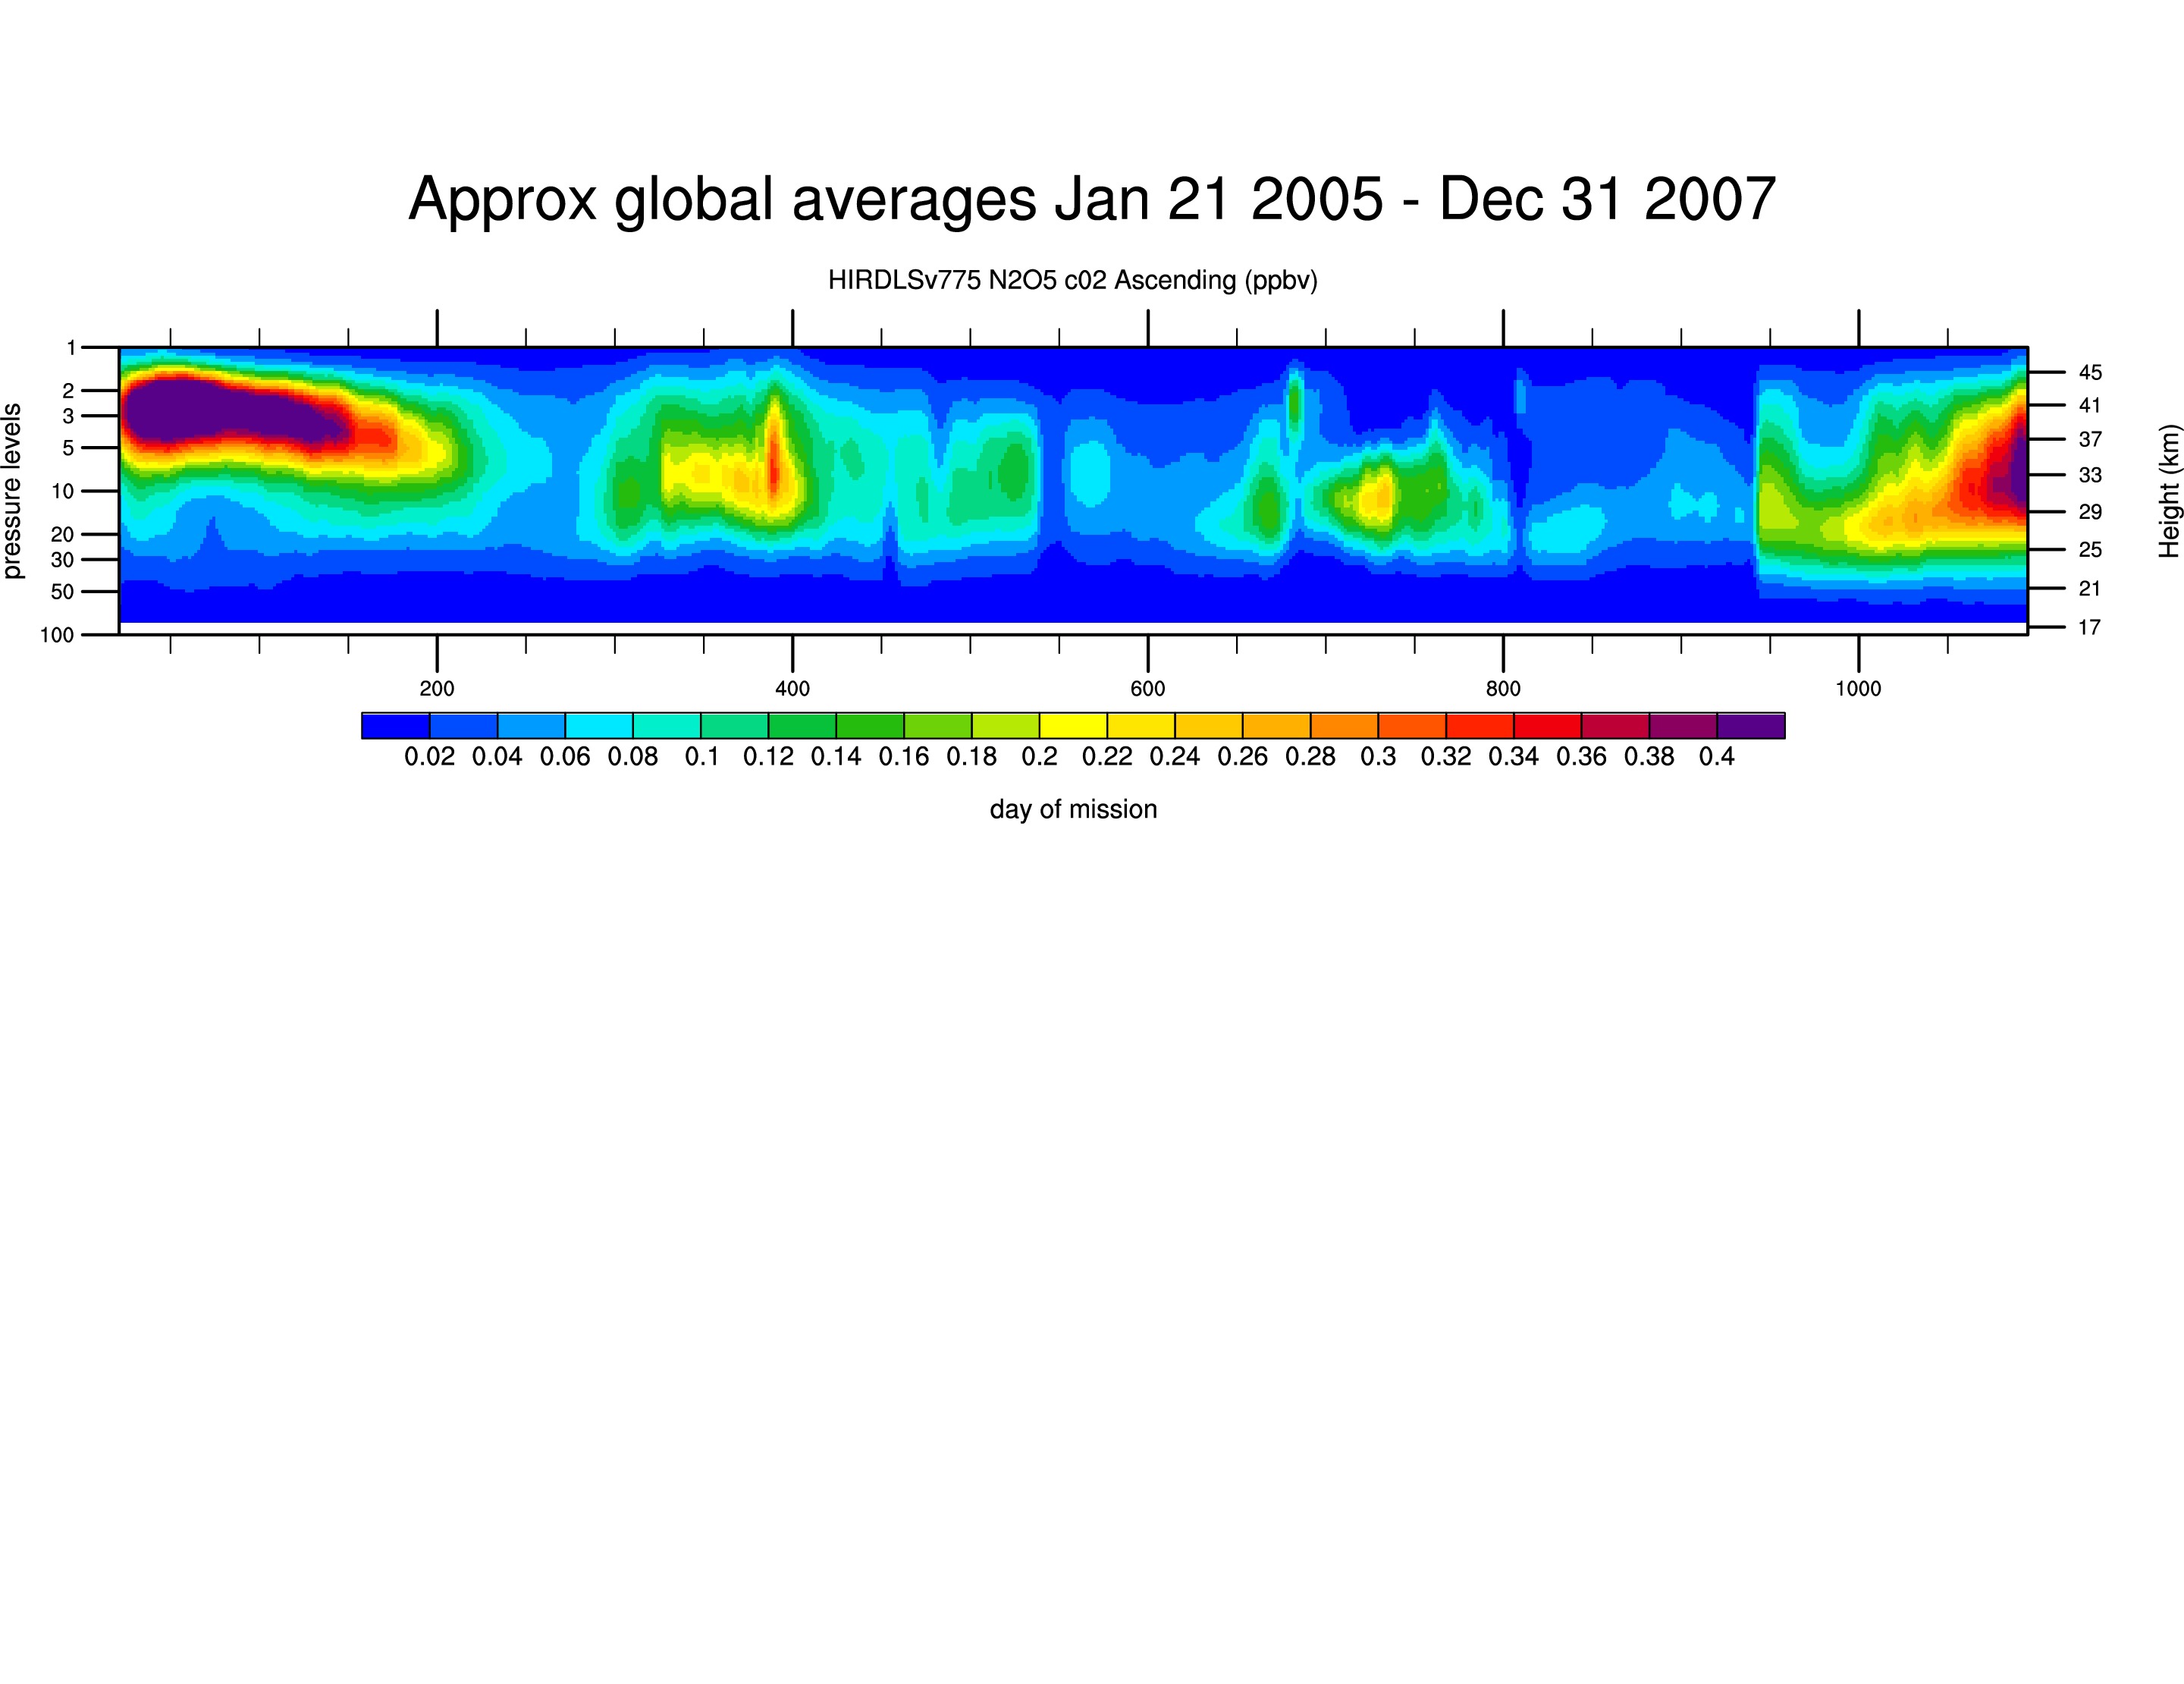
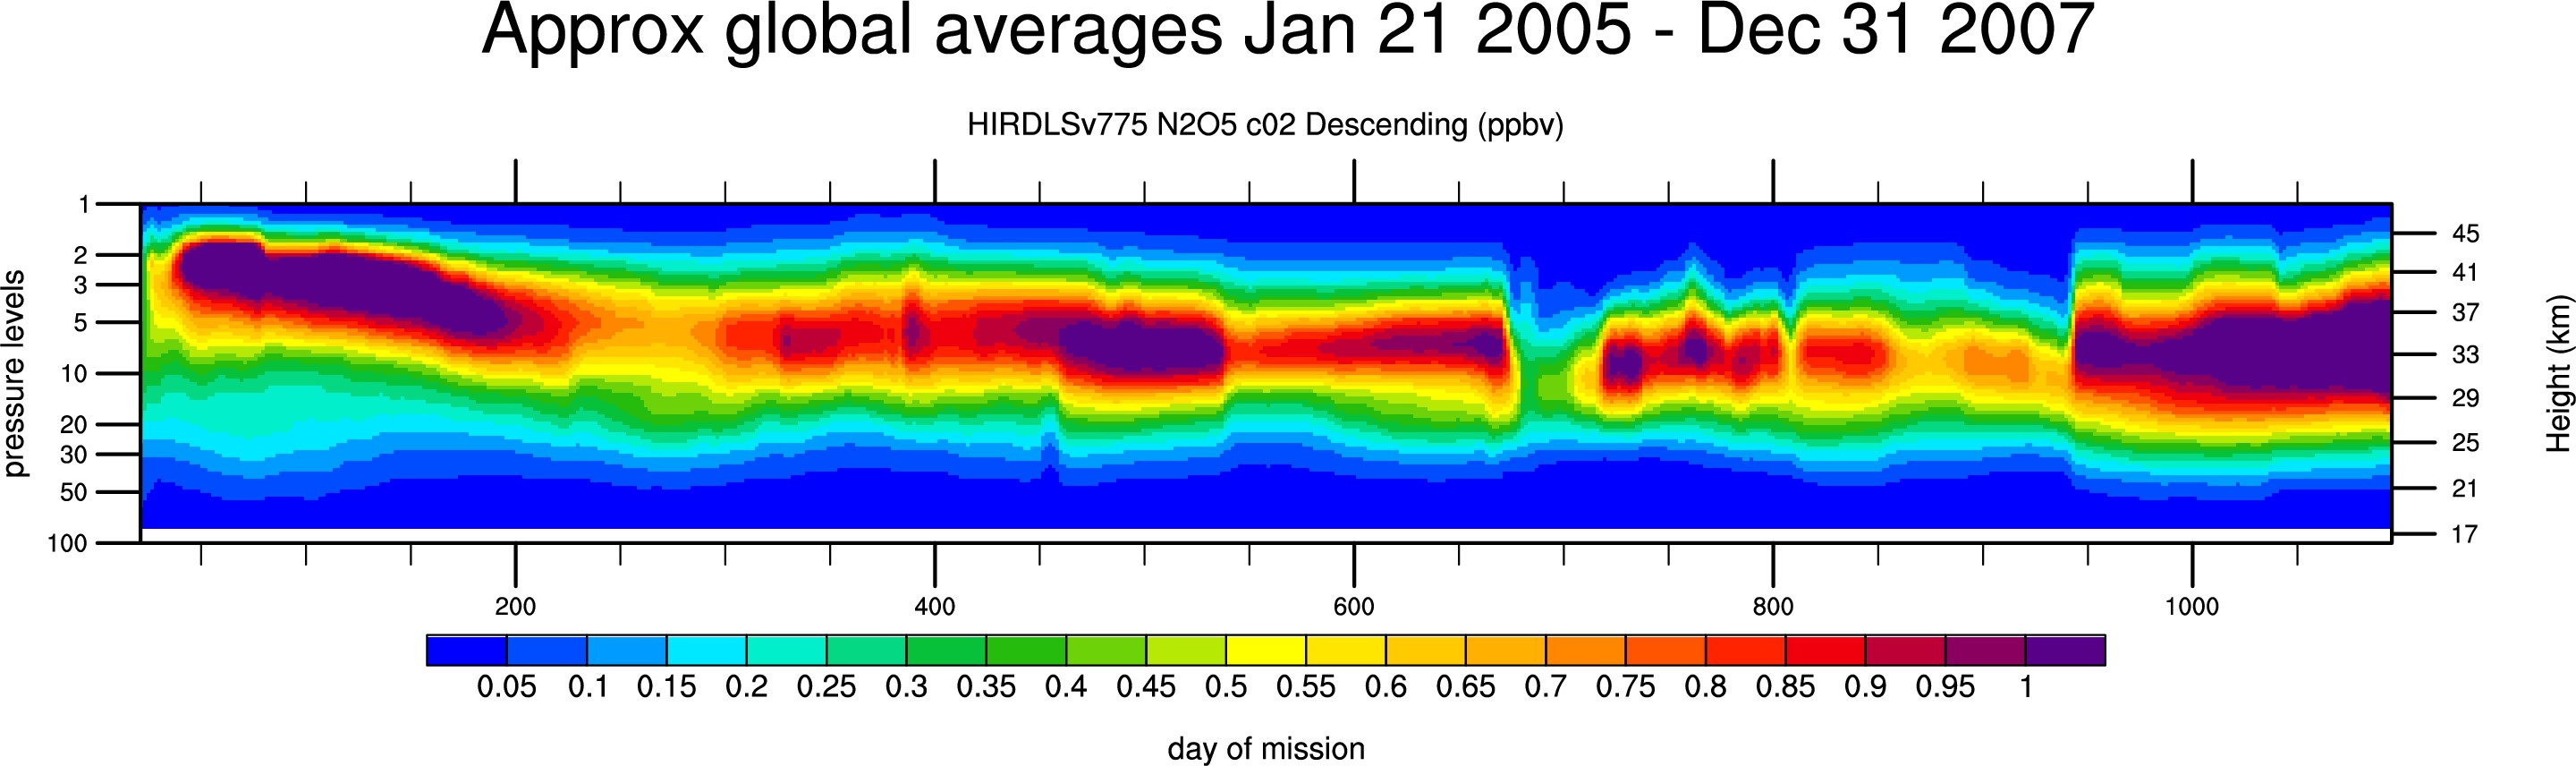
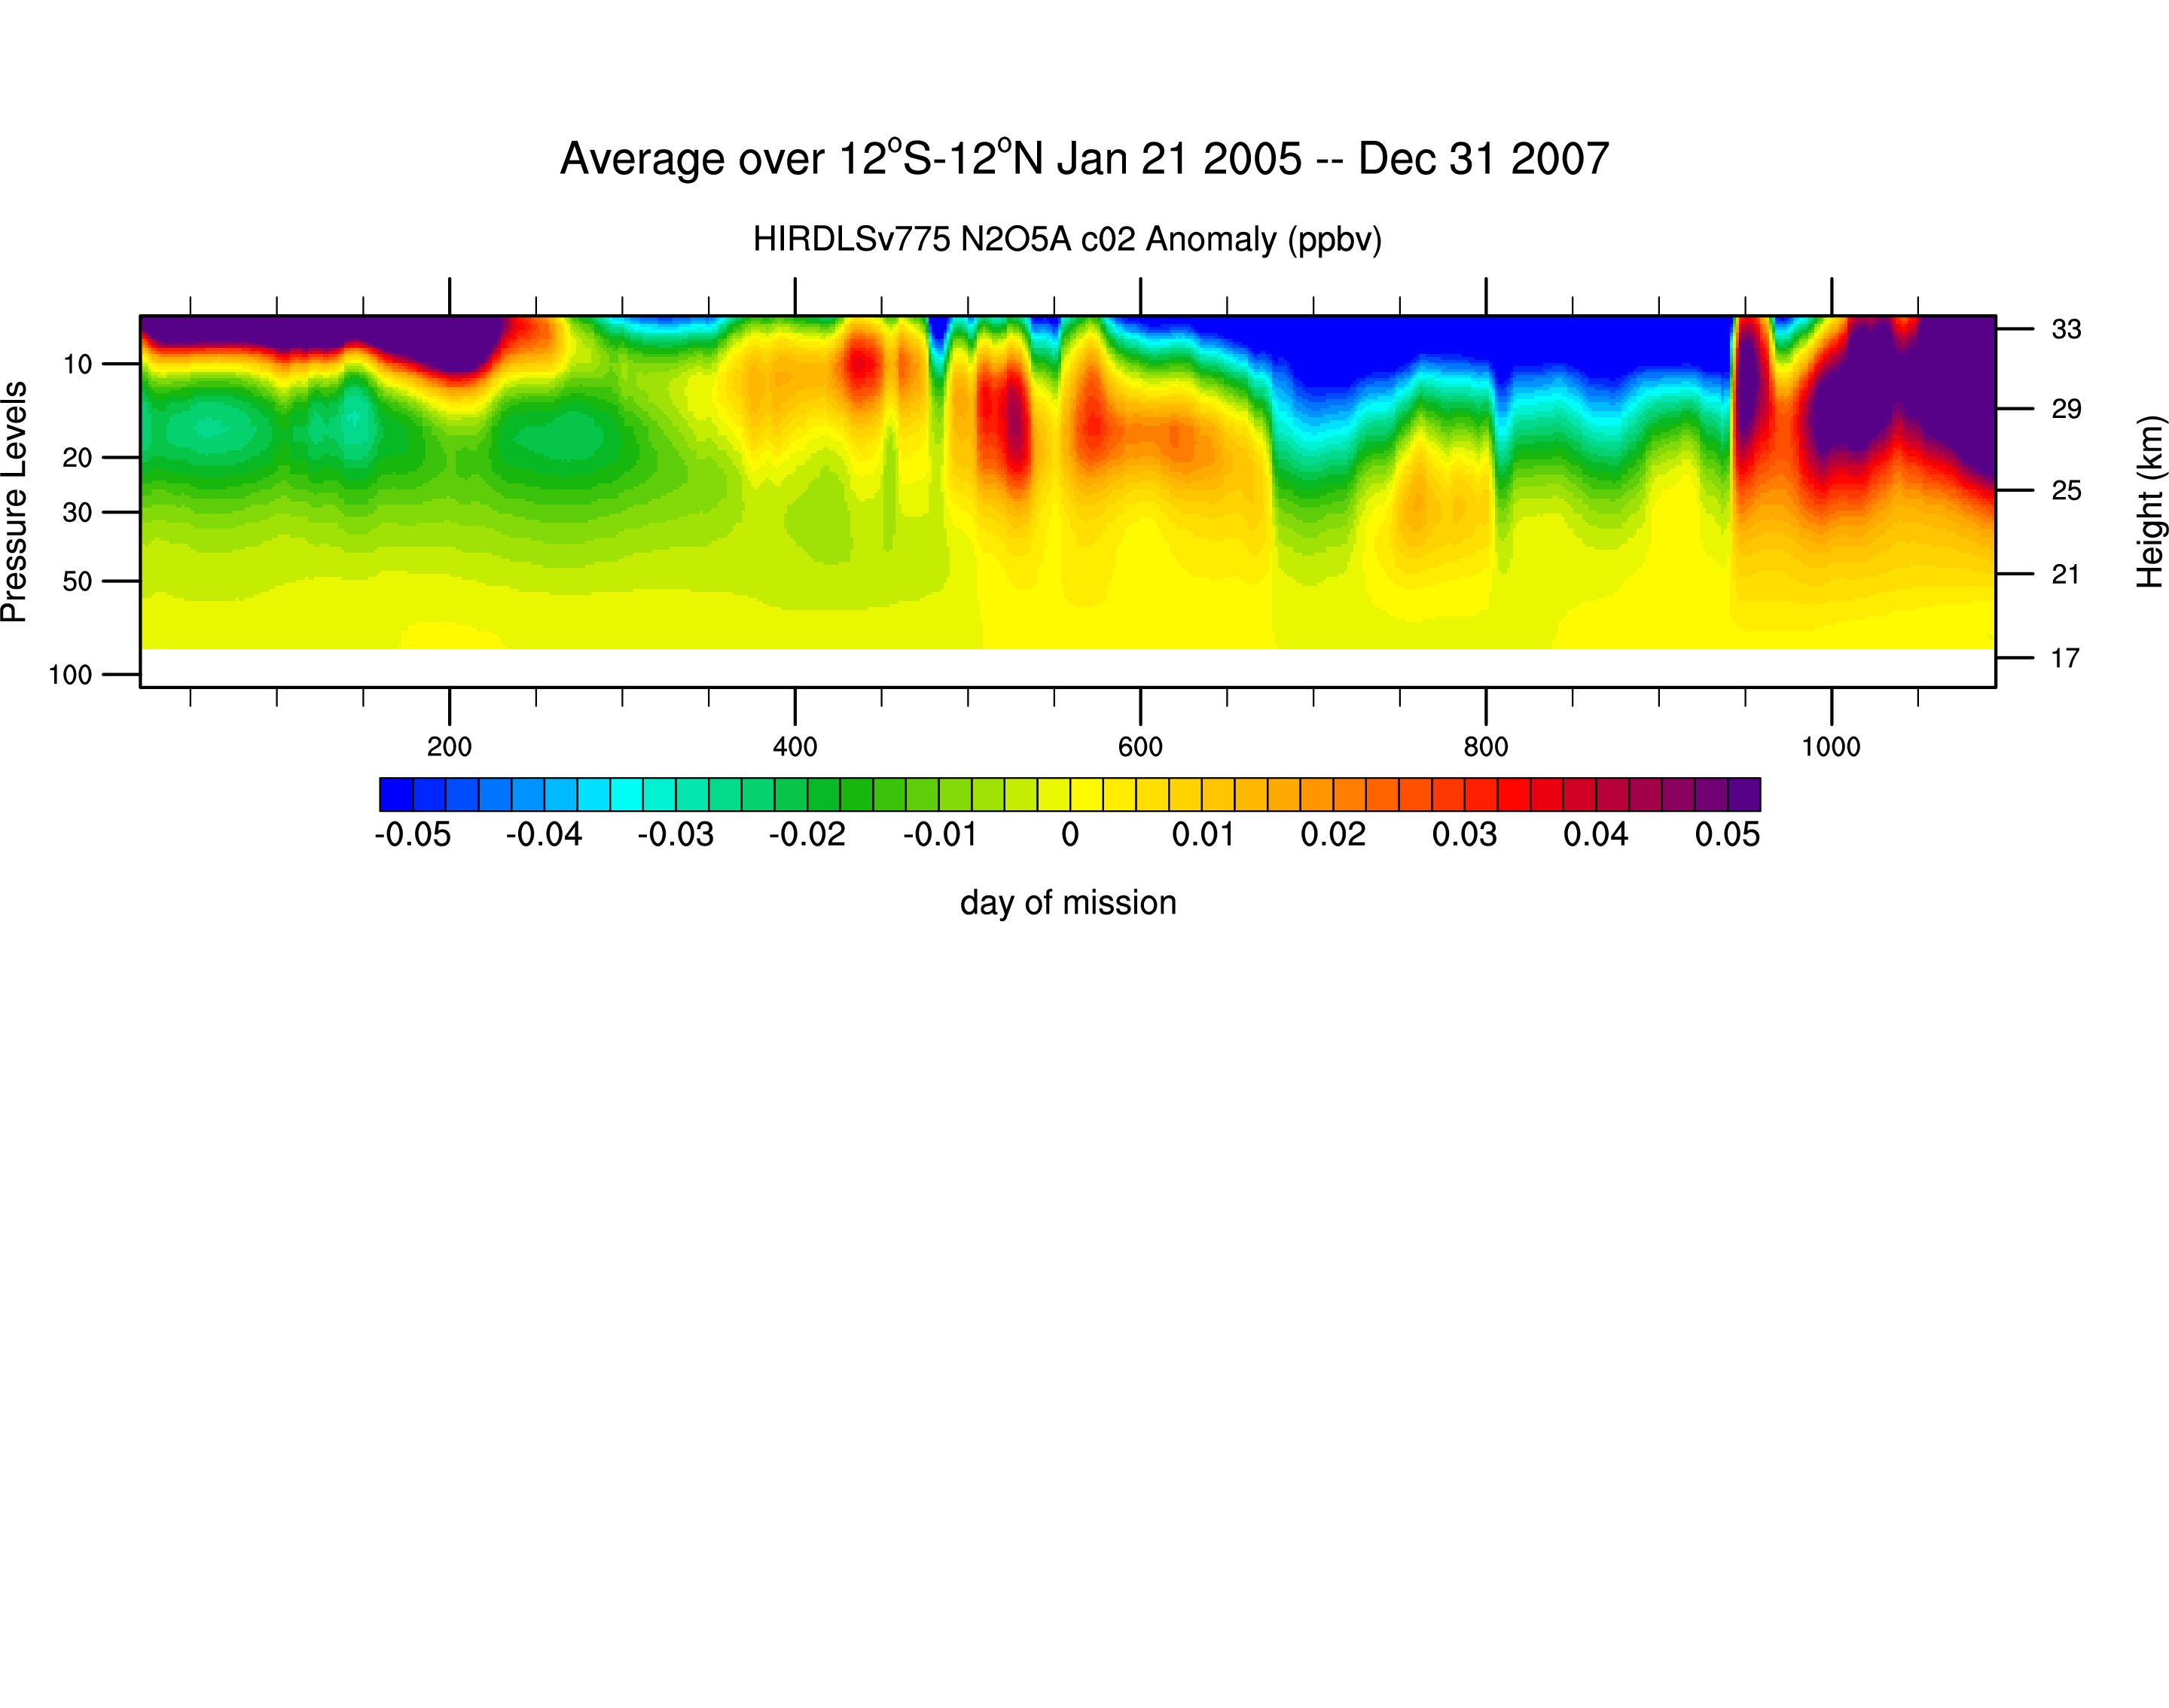
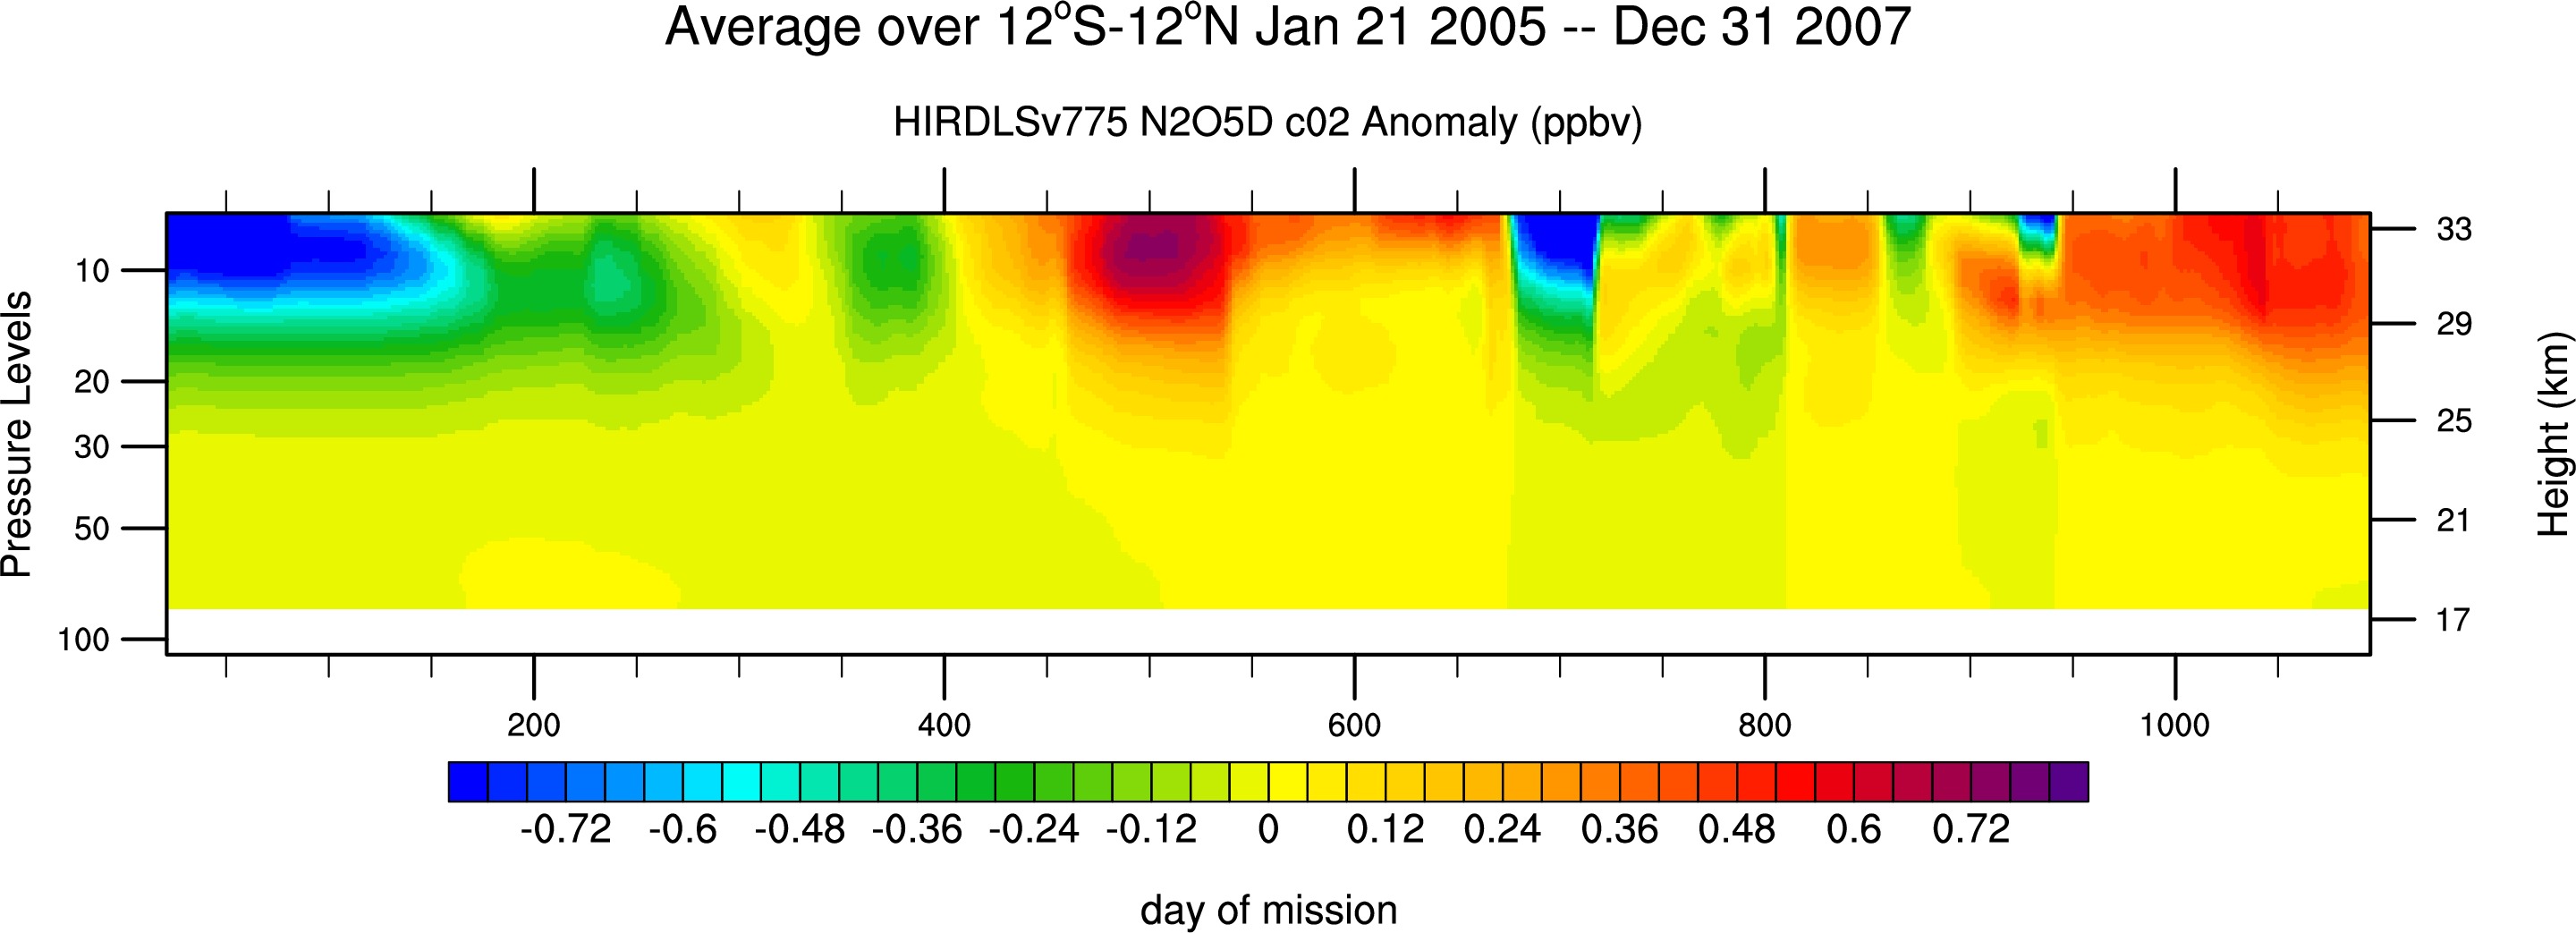
N2O5: c02: up scans:Ascending (jpg),Descending (jpg)
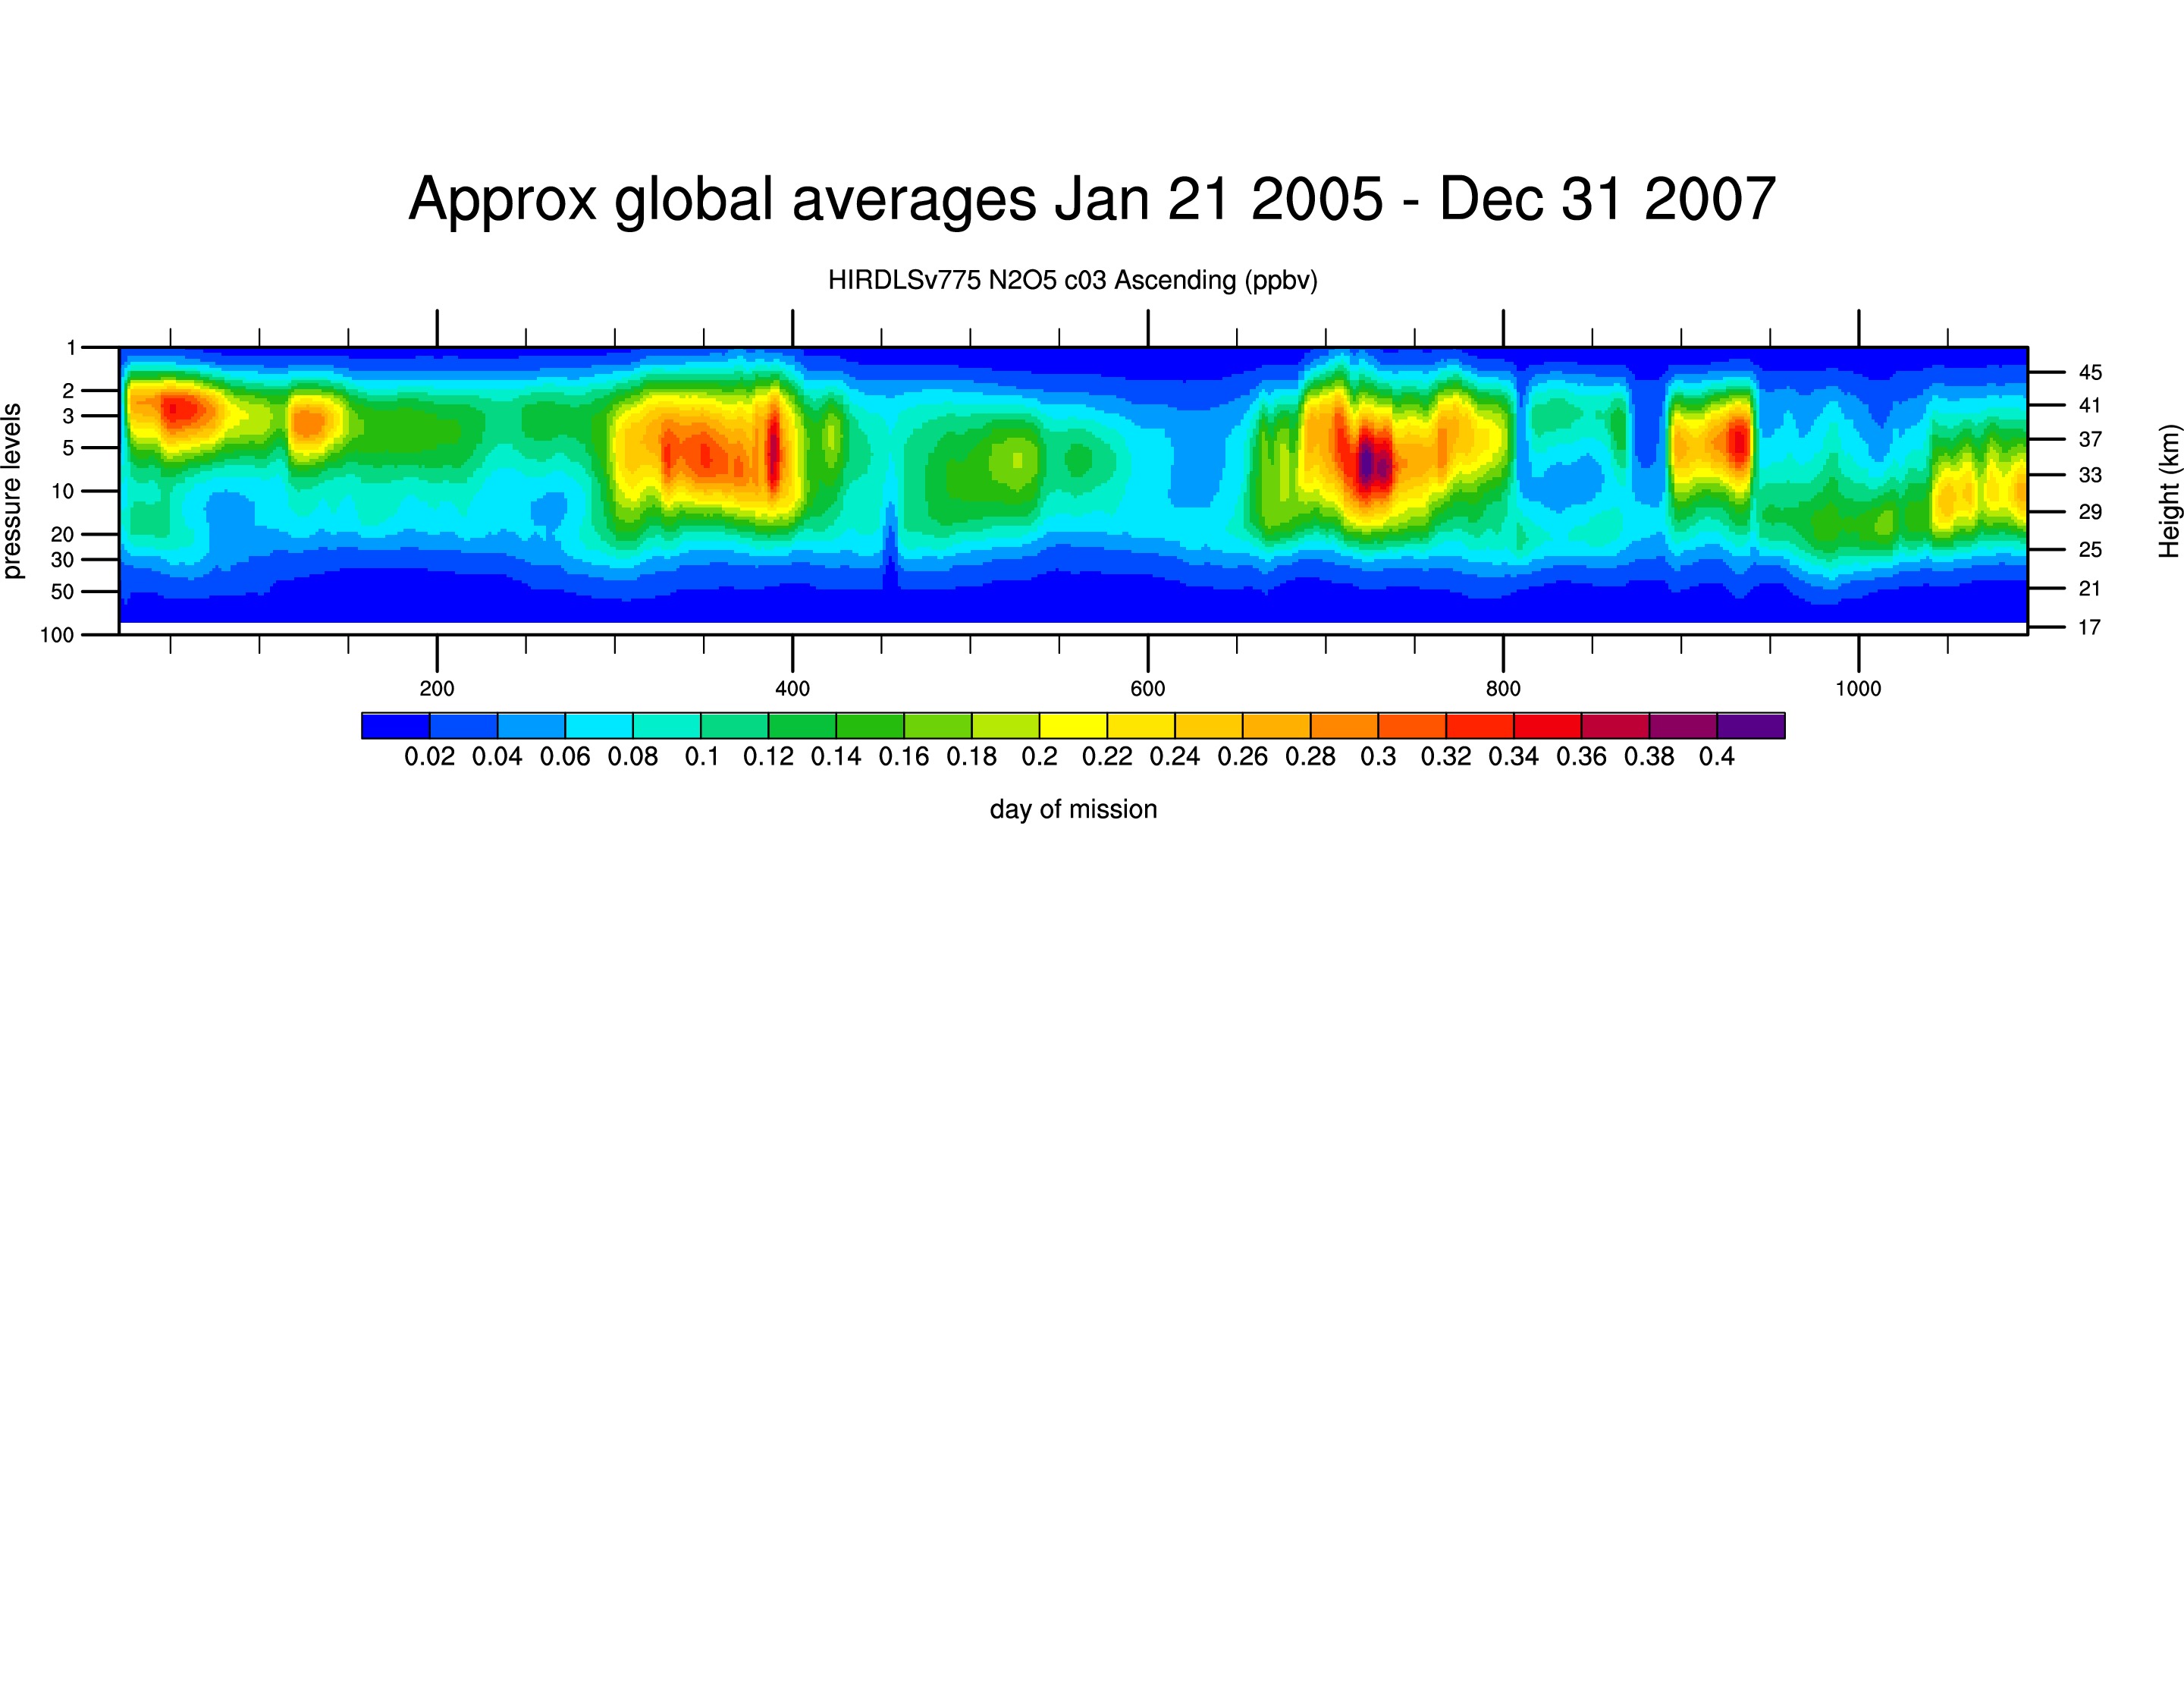
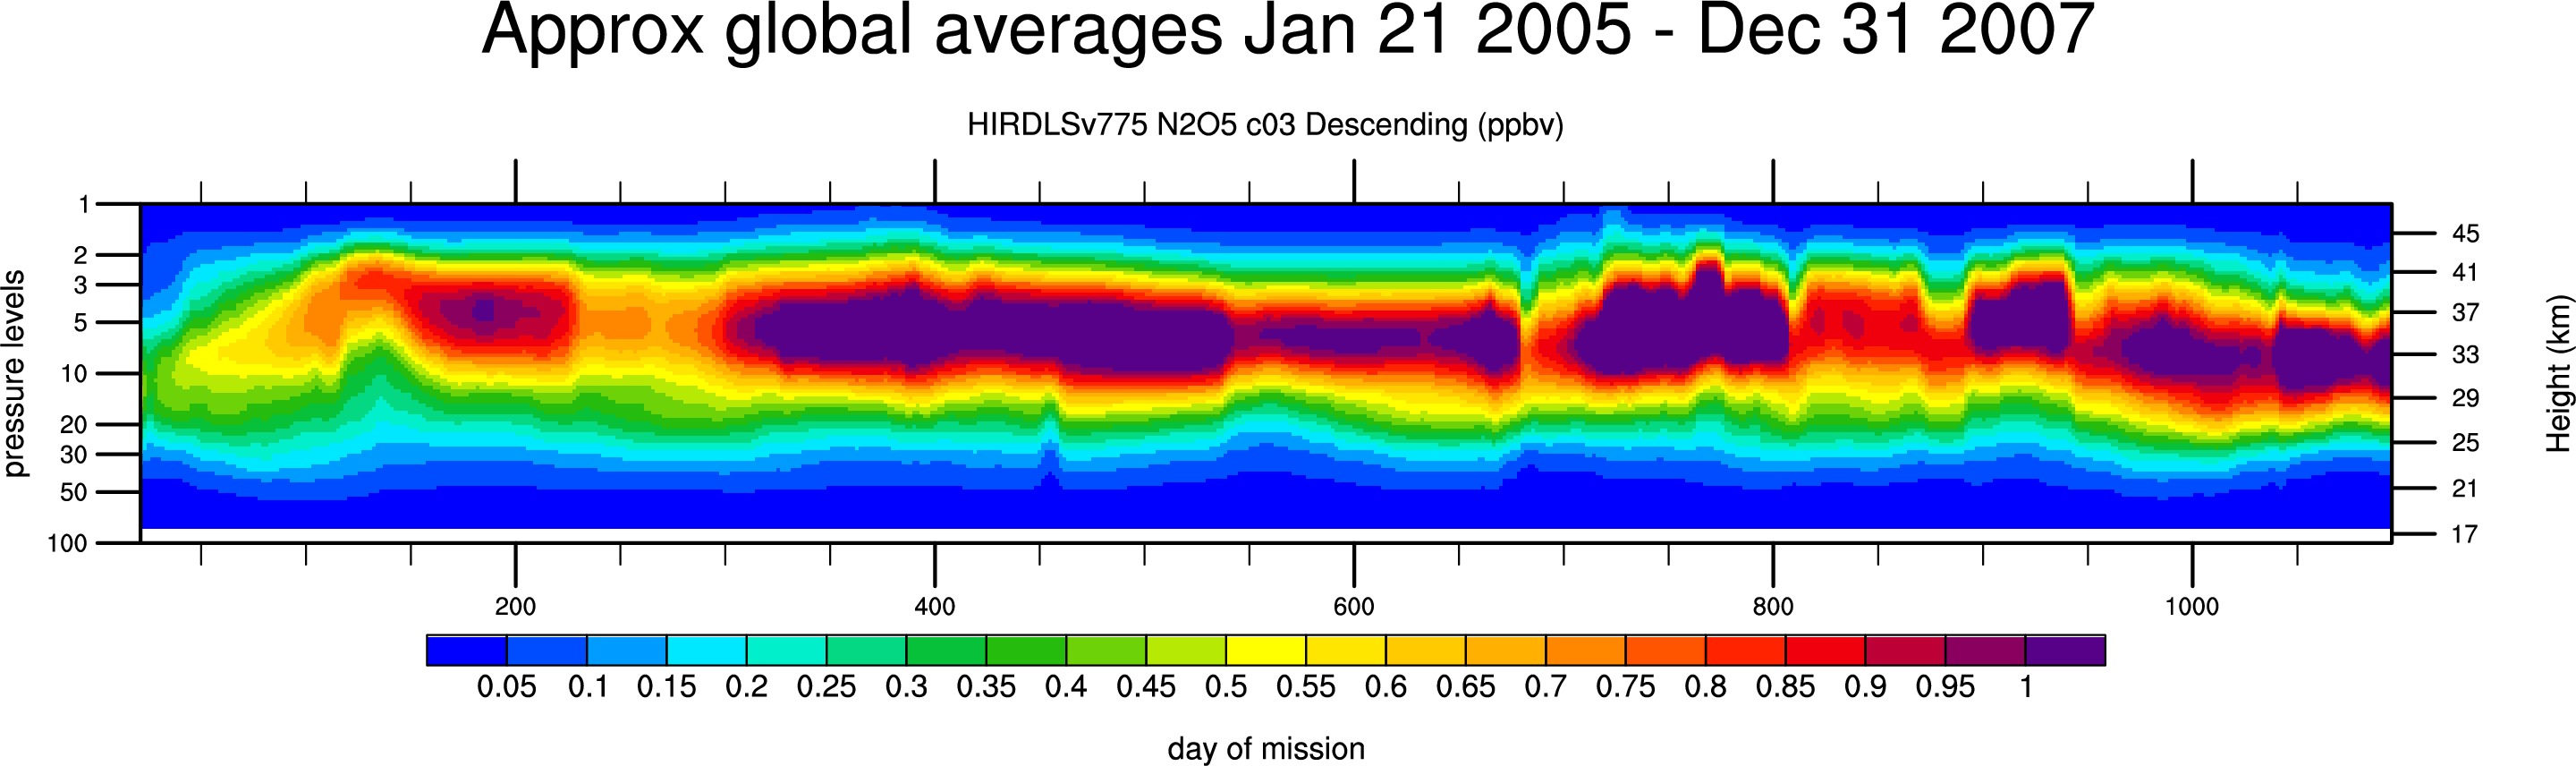
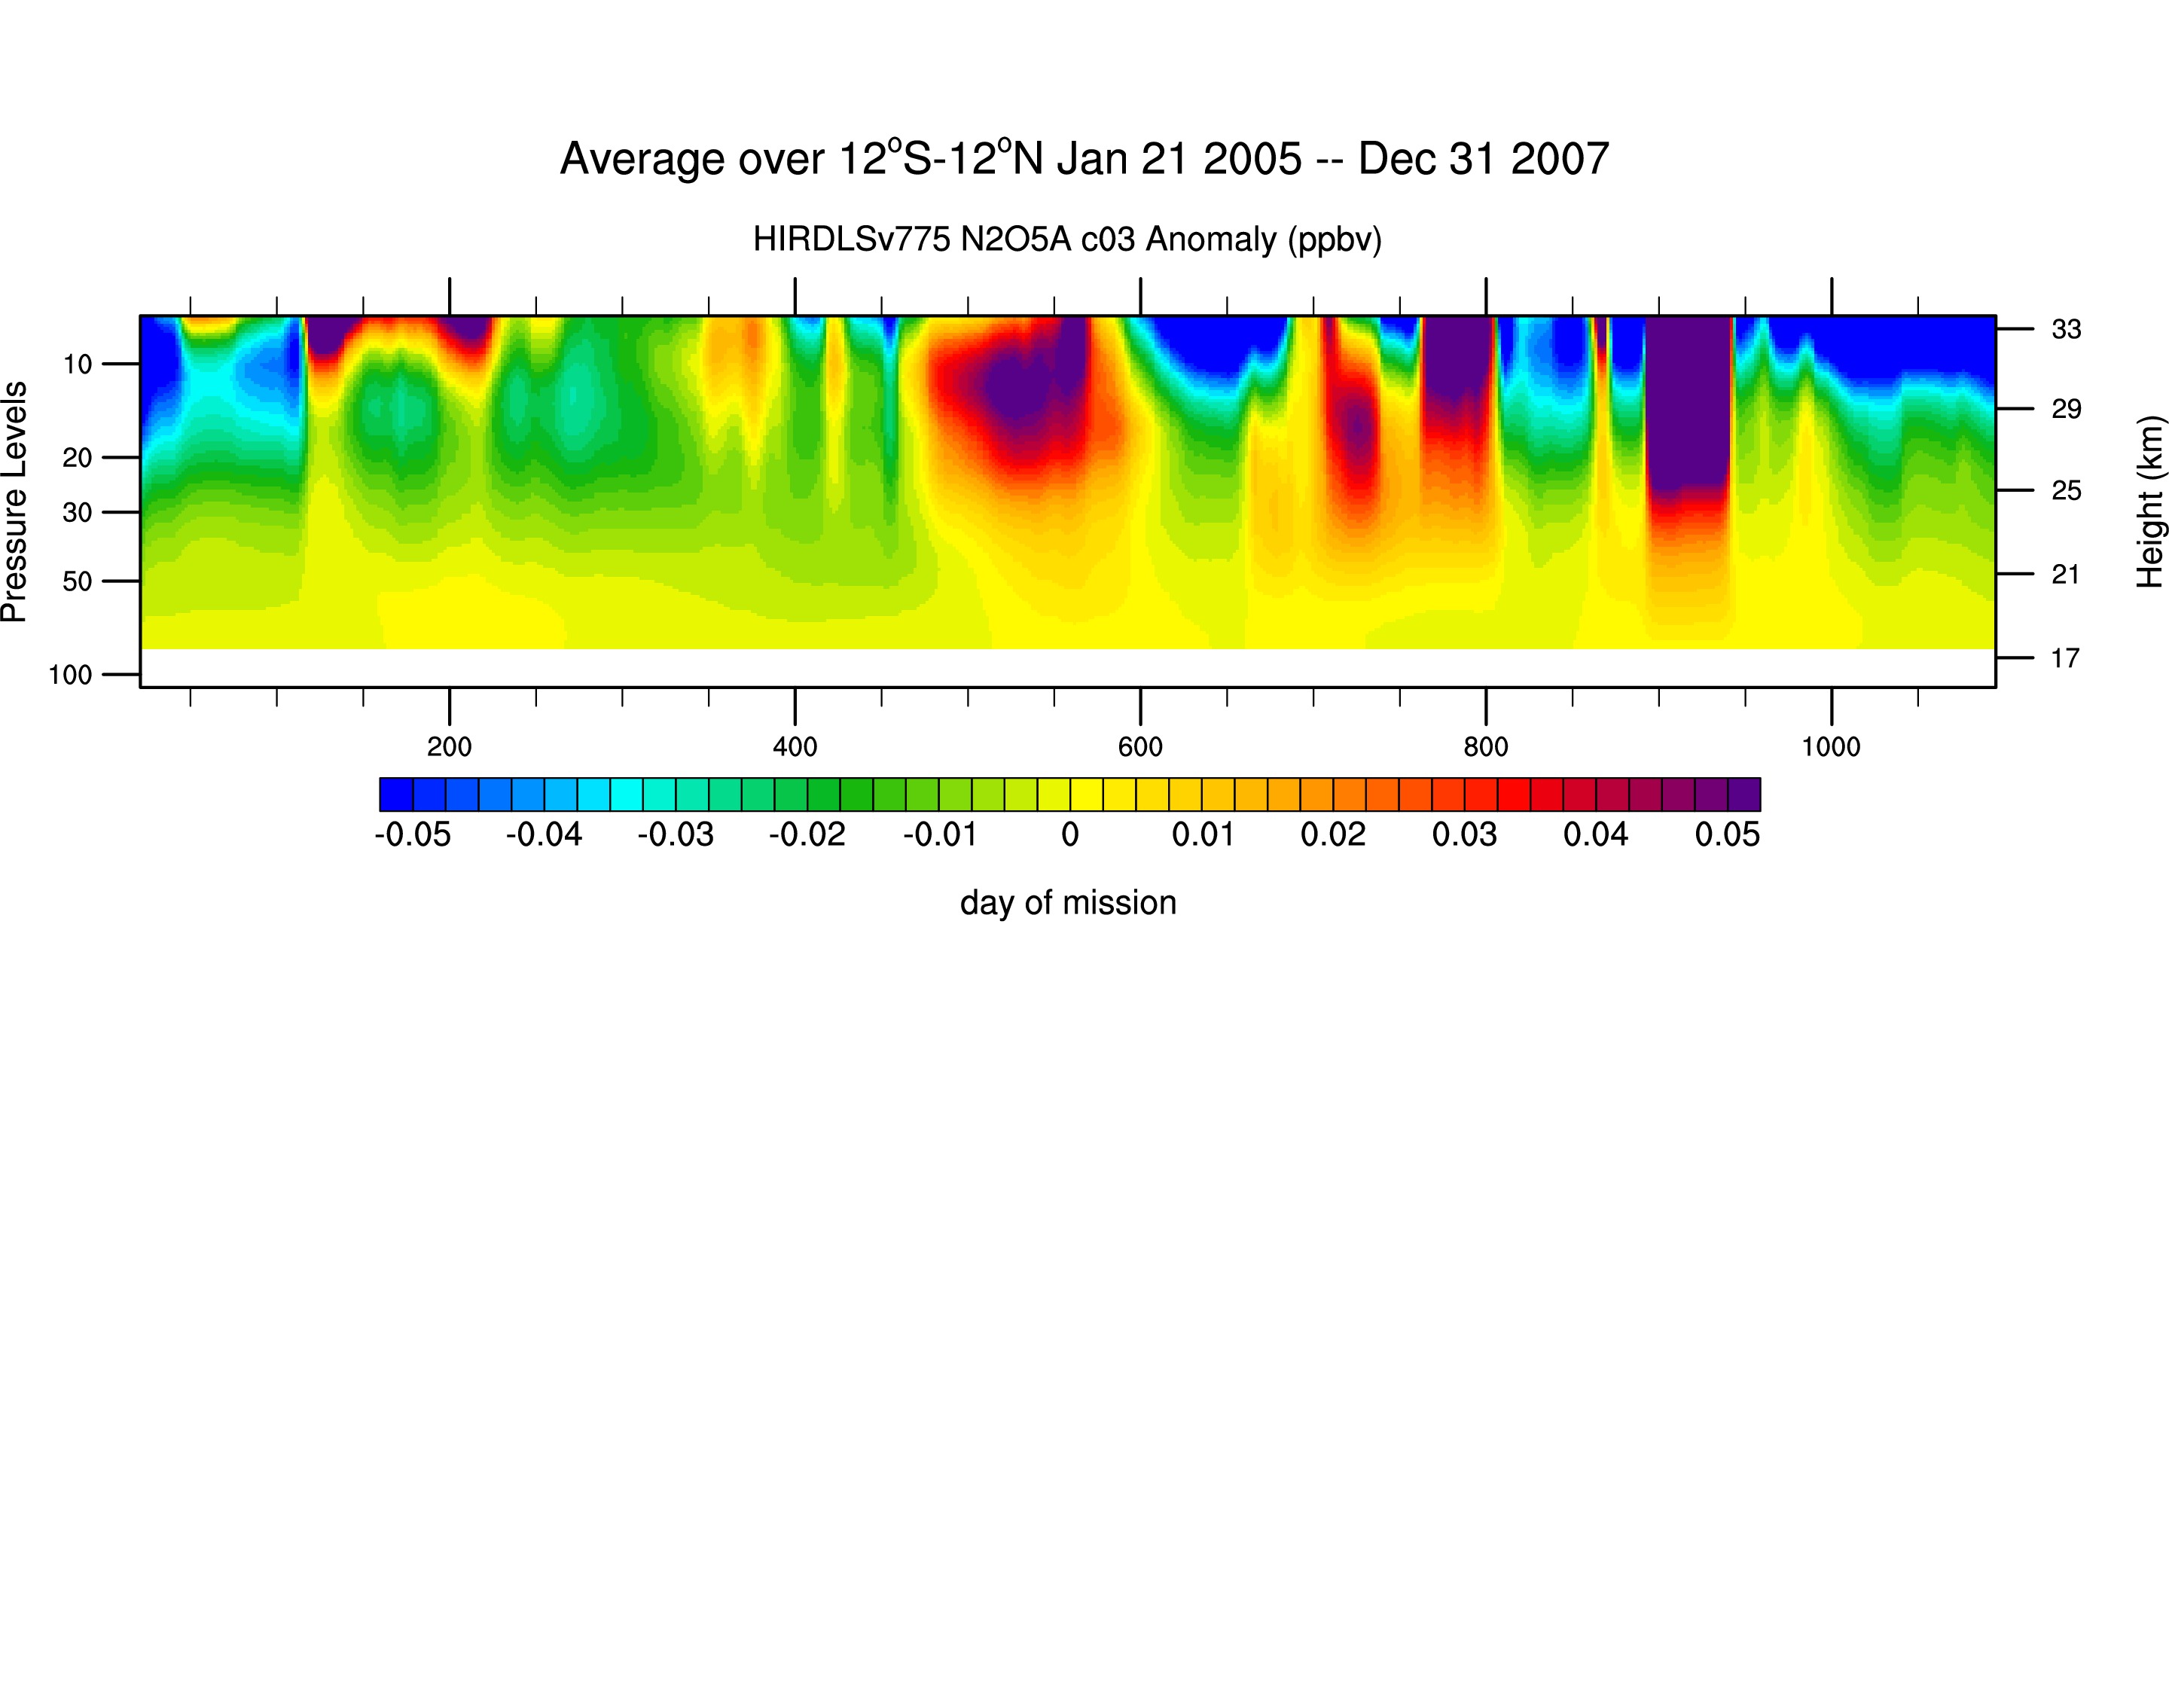
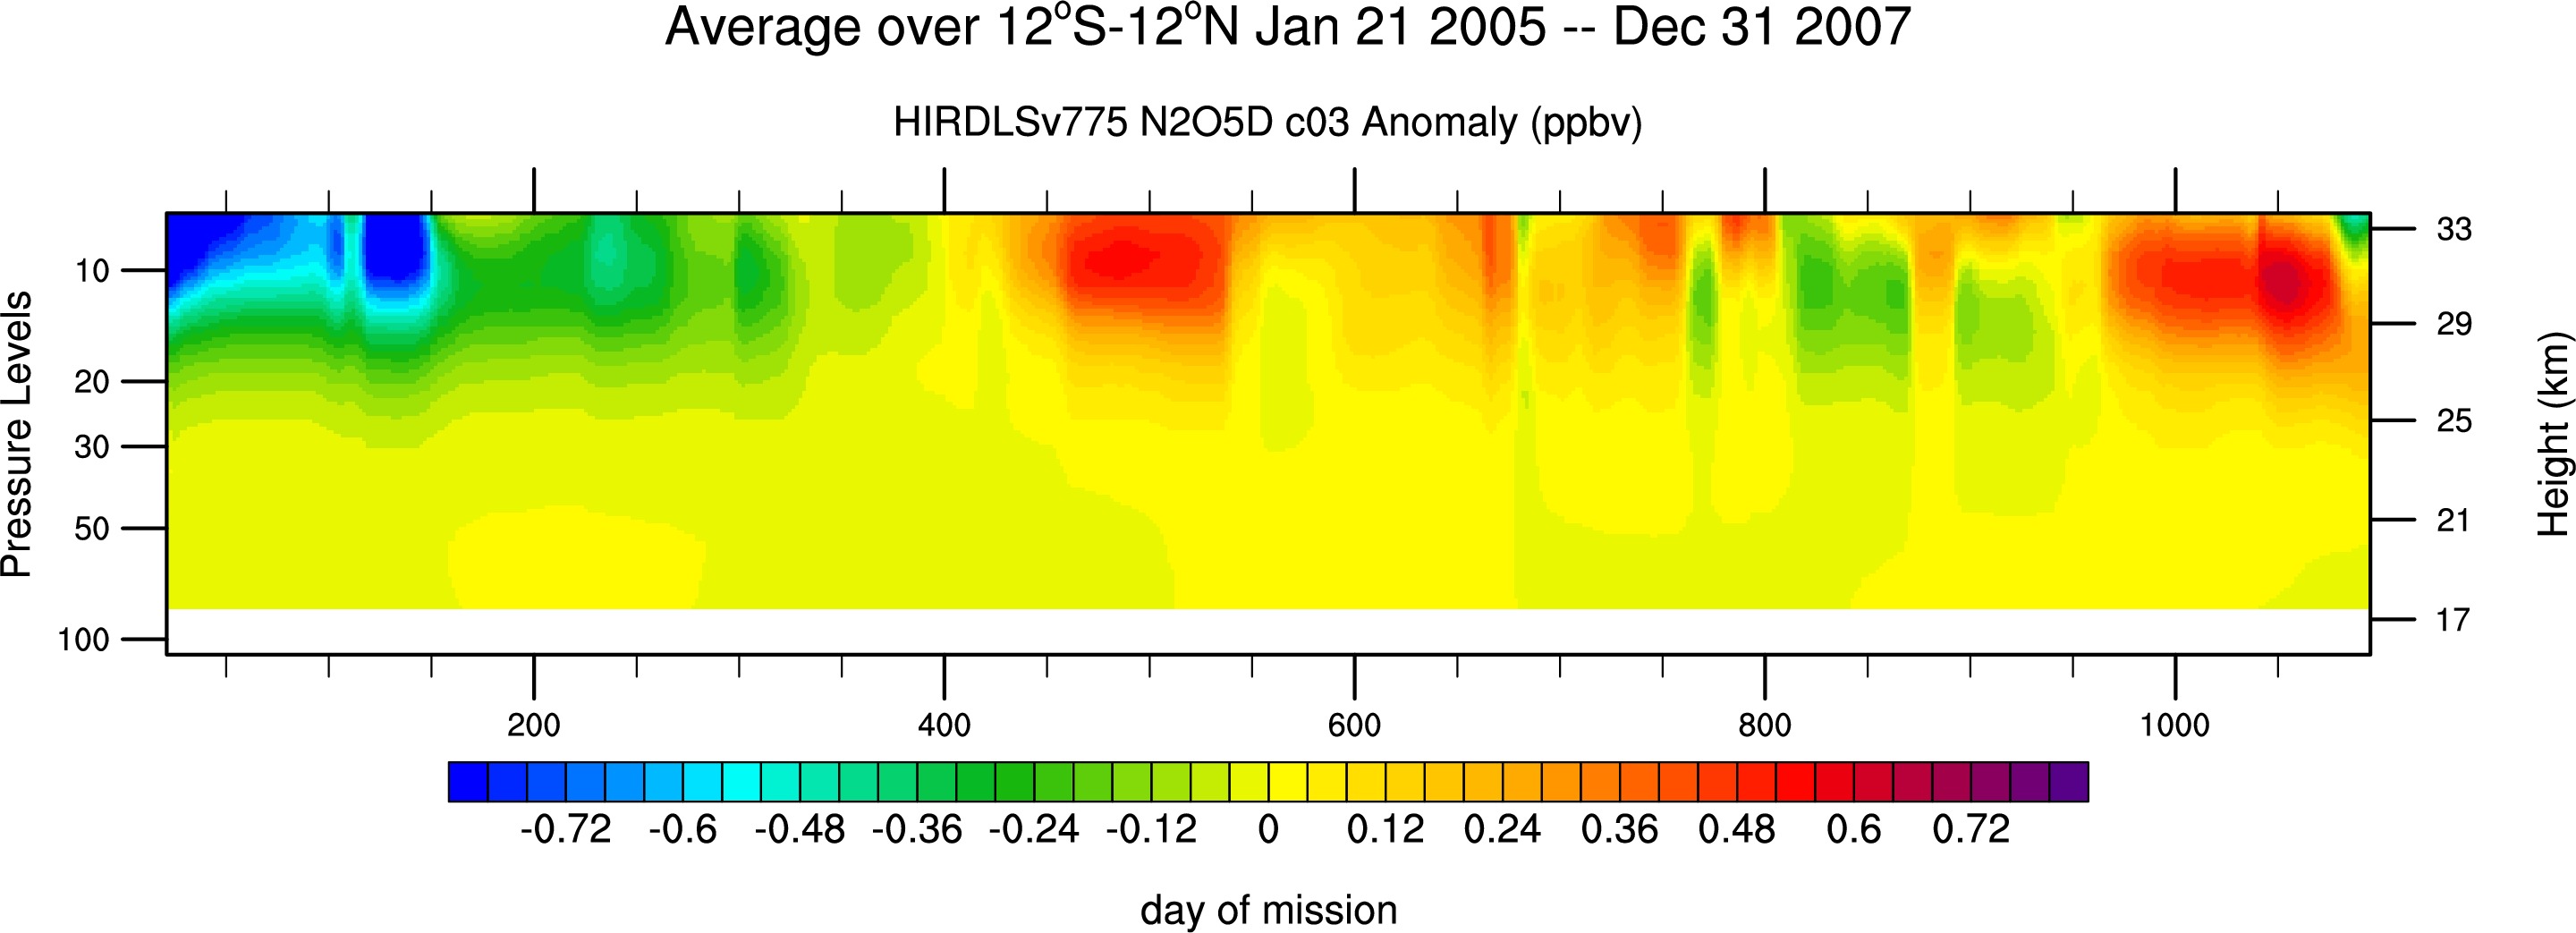
N2O5: c03: down scans:Ascending (jpg),Descending (jpg)
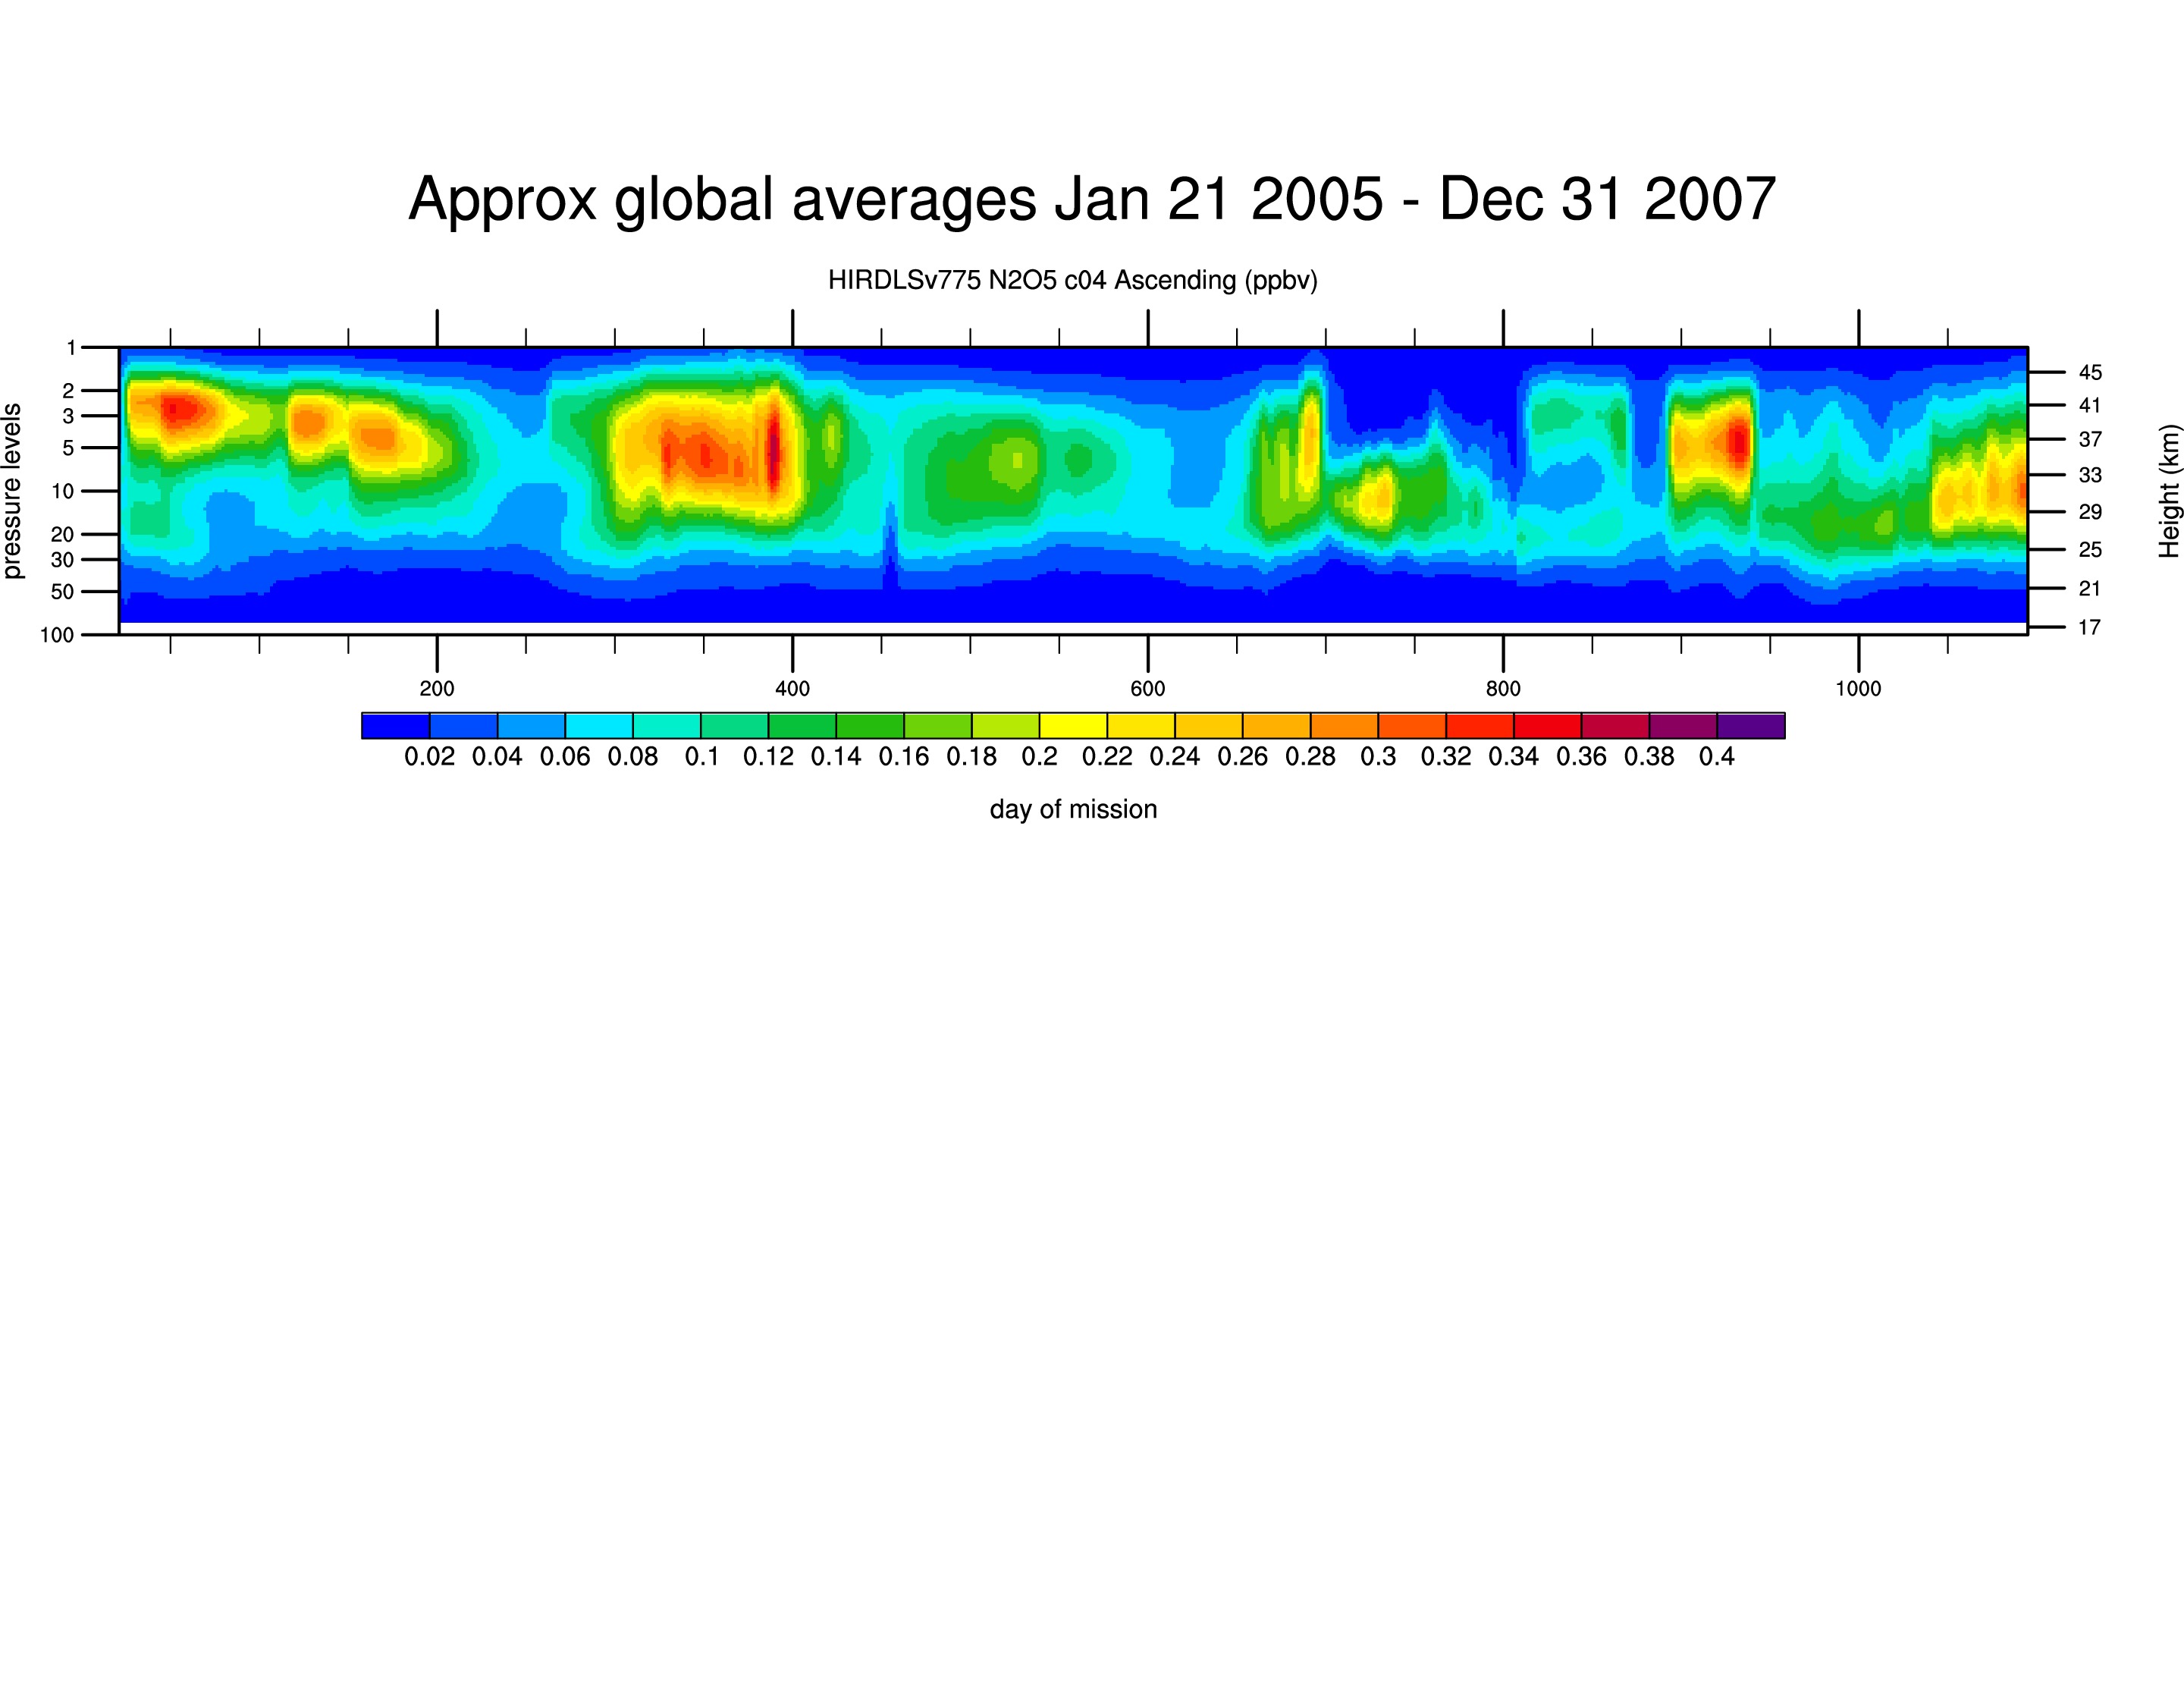
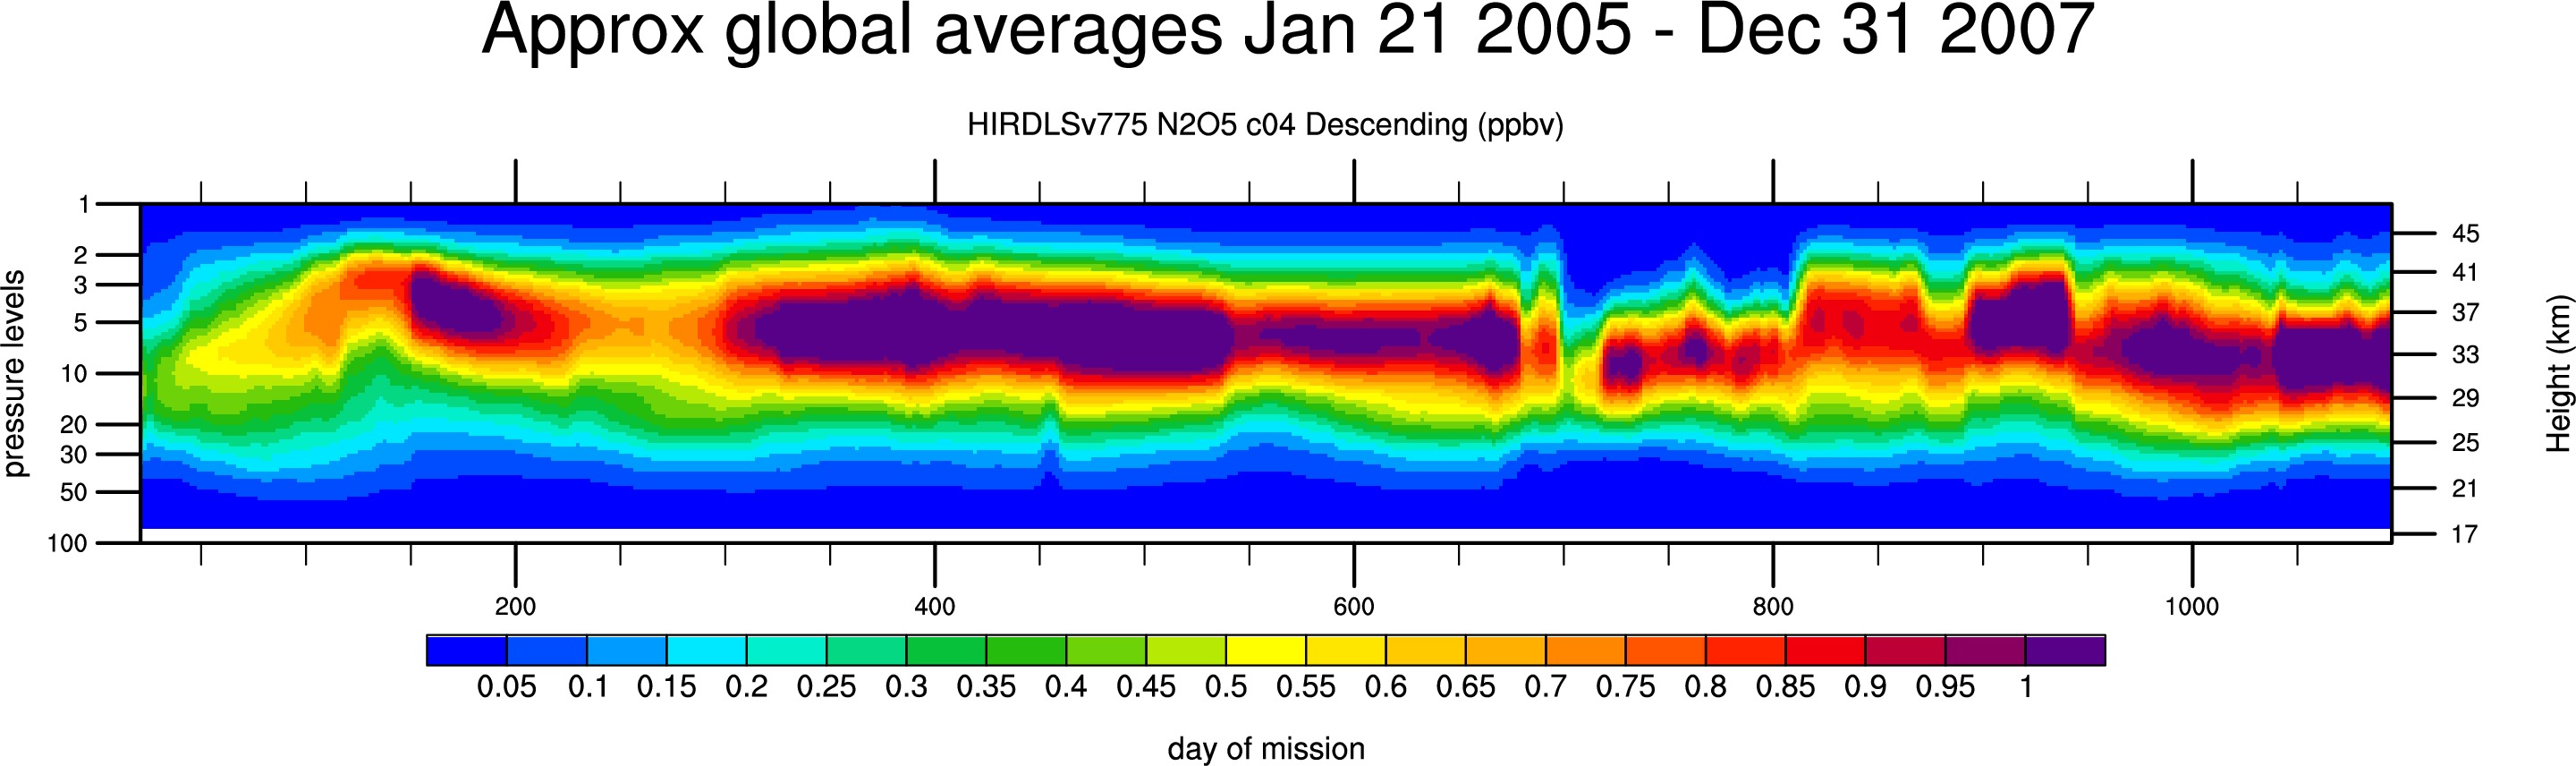
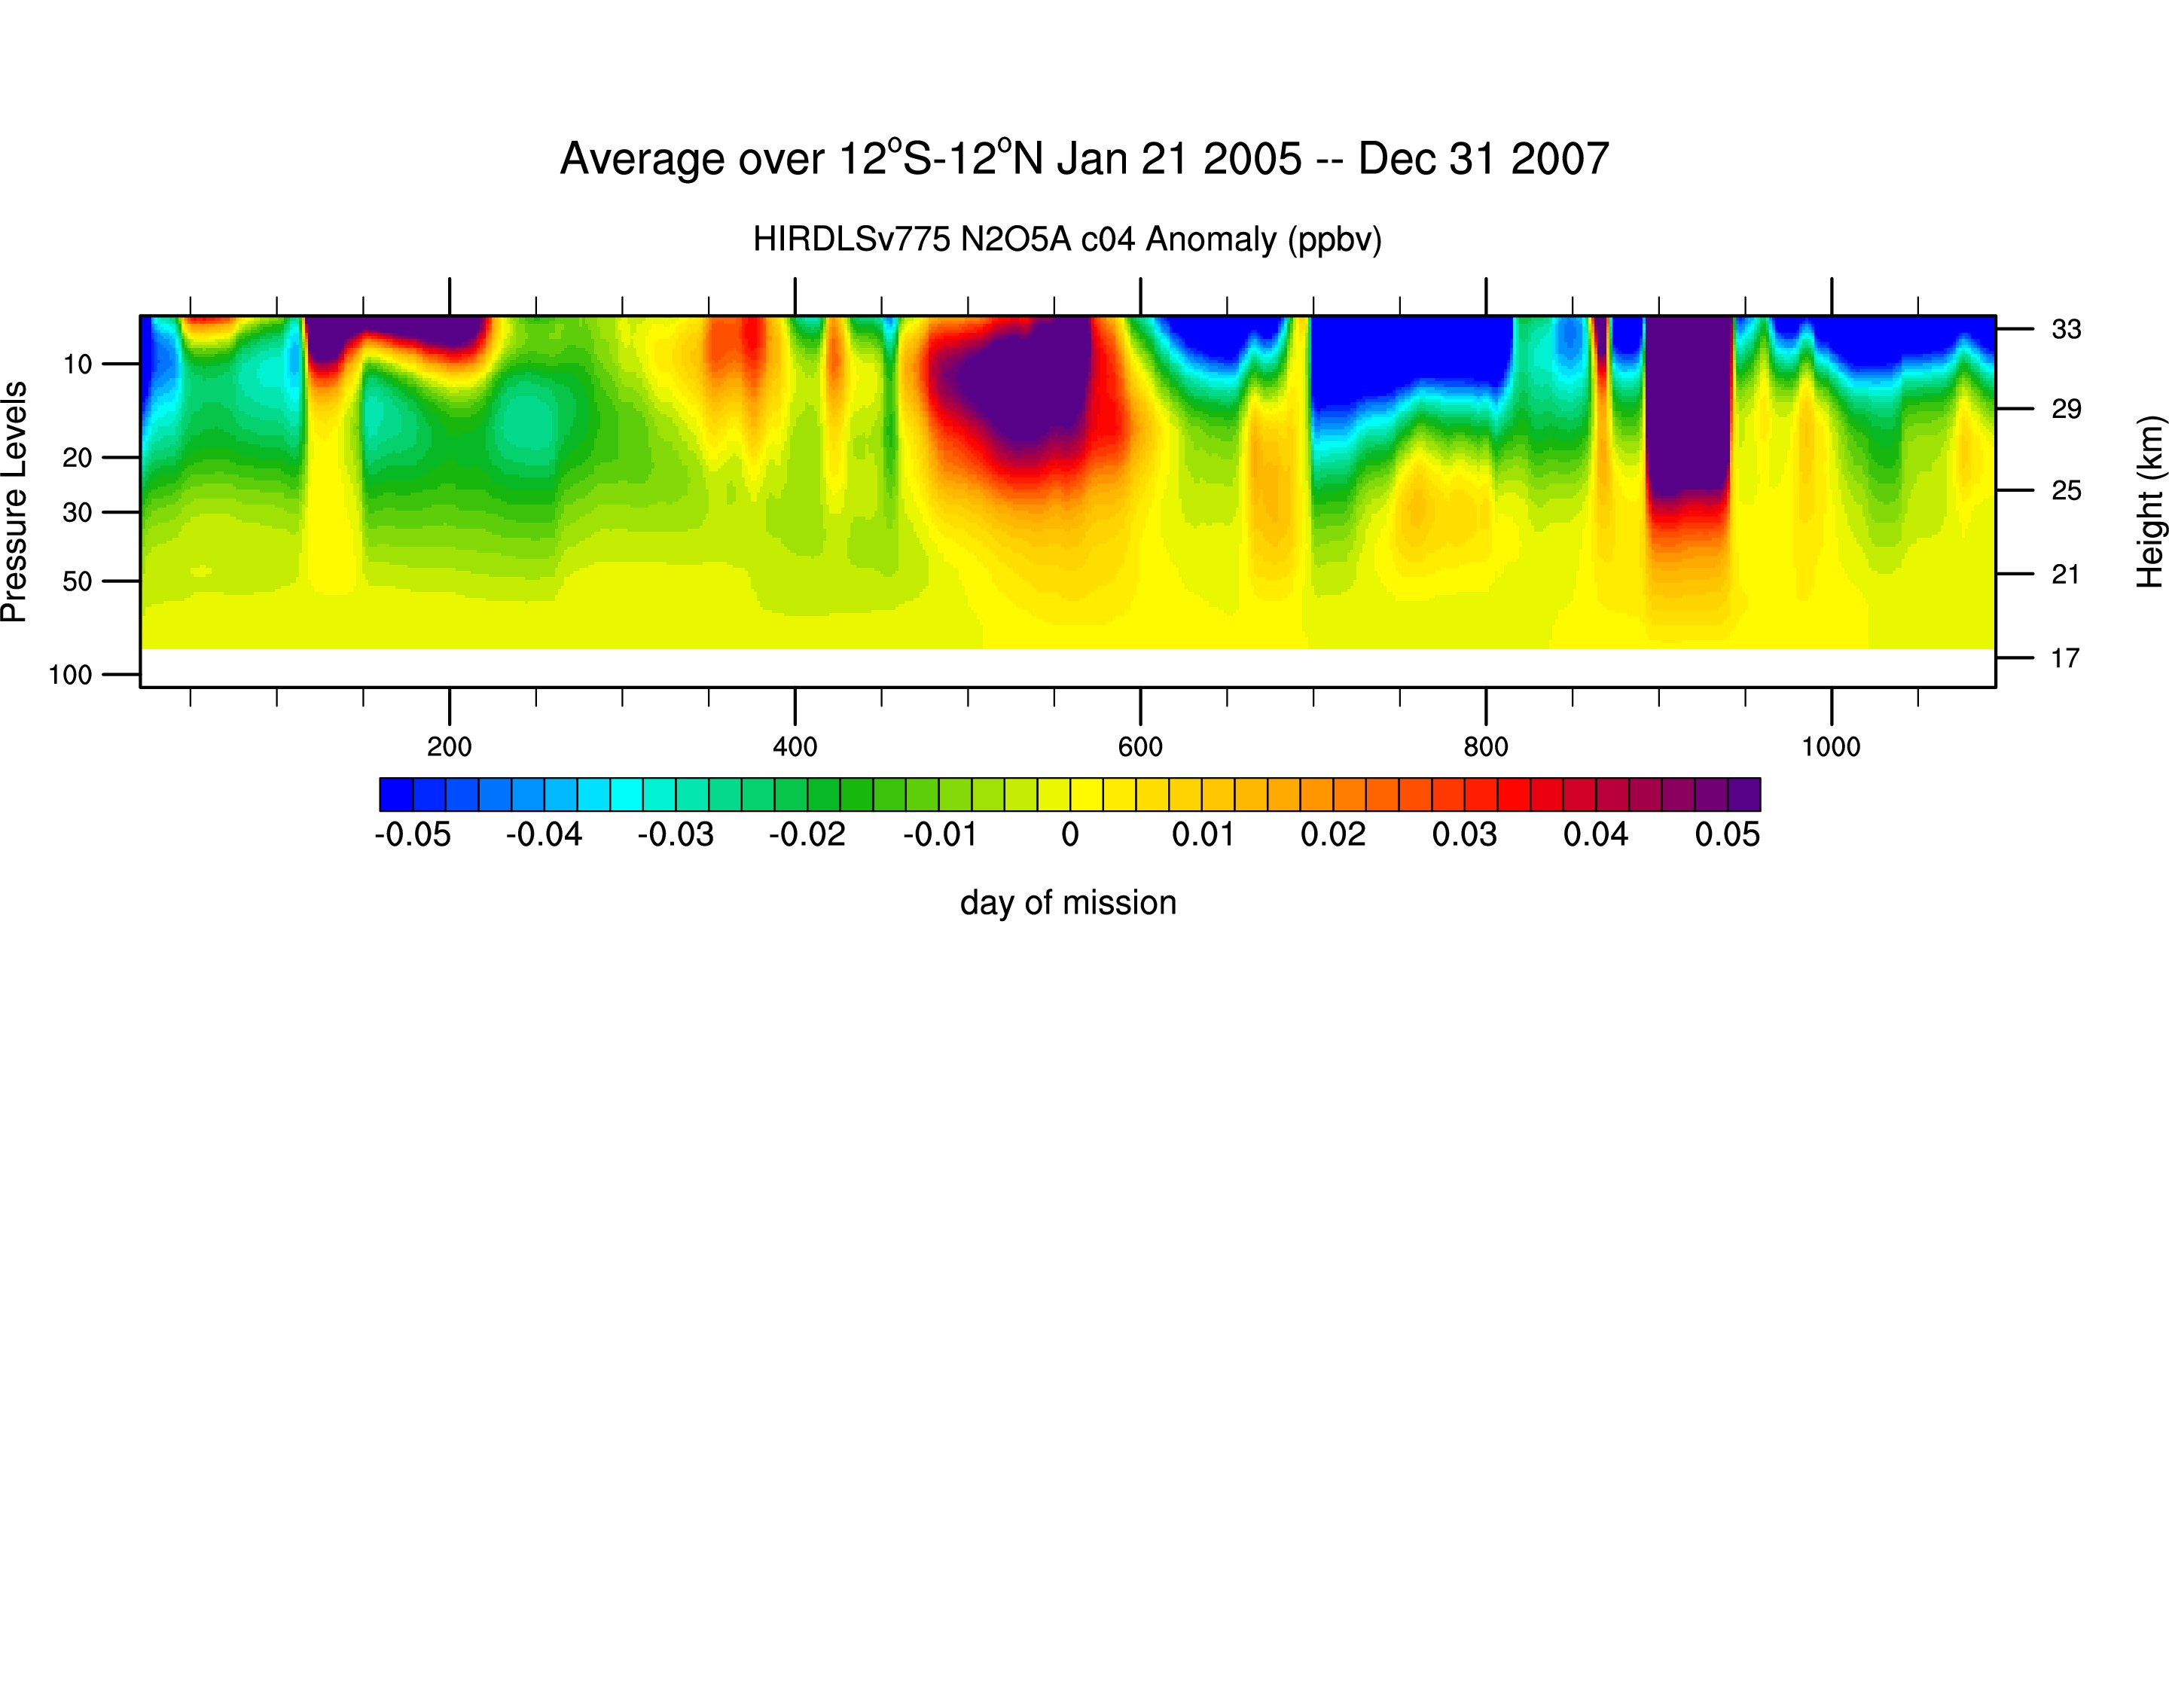
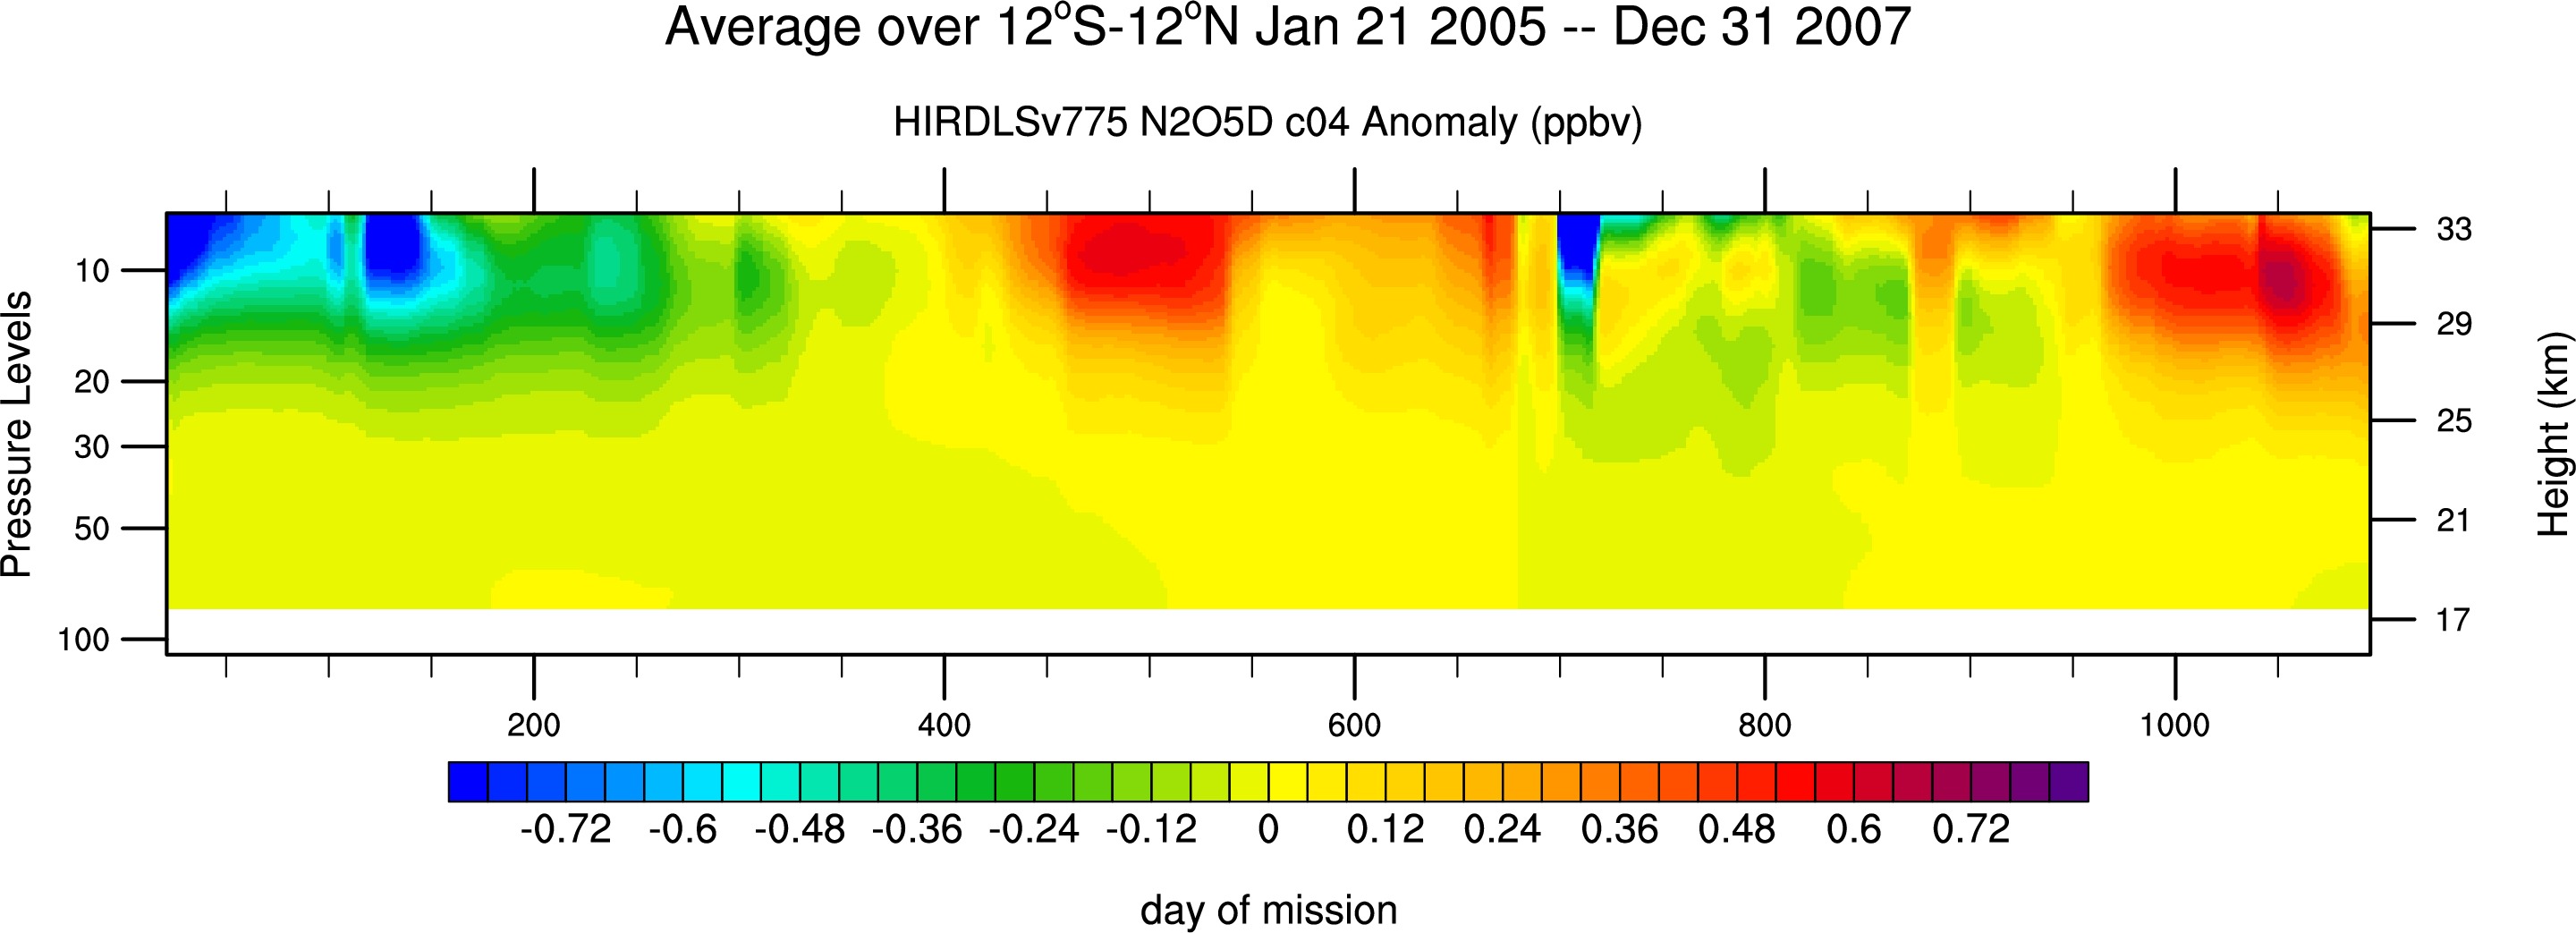
N2O5: c04: mixed up & down scans:Ascending (jpg),Descending (jpg)
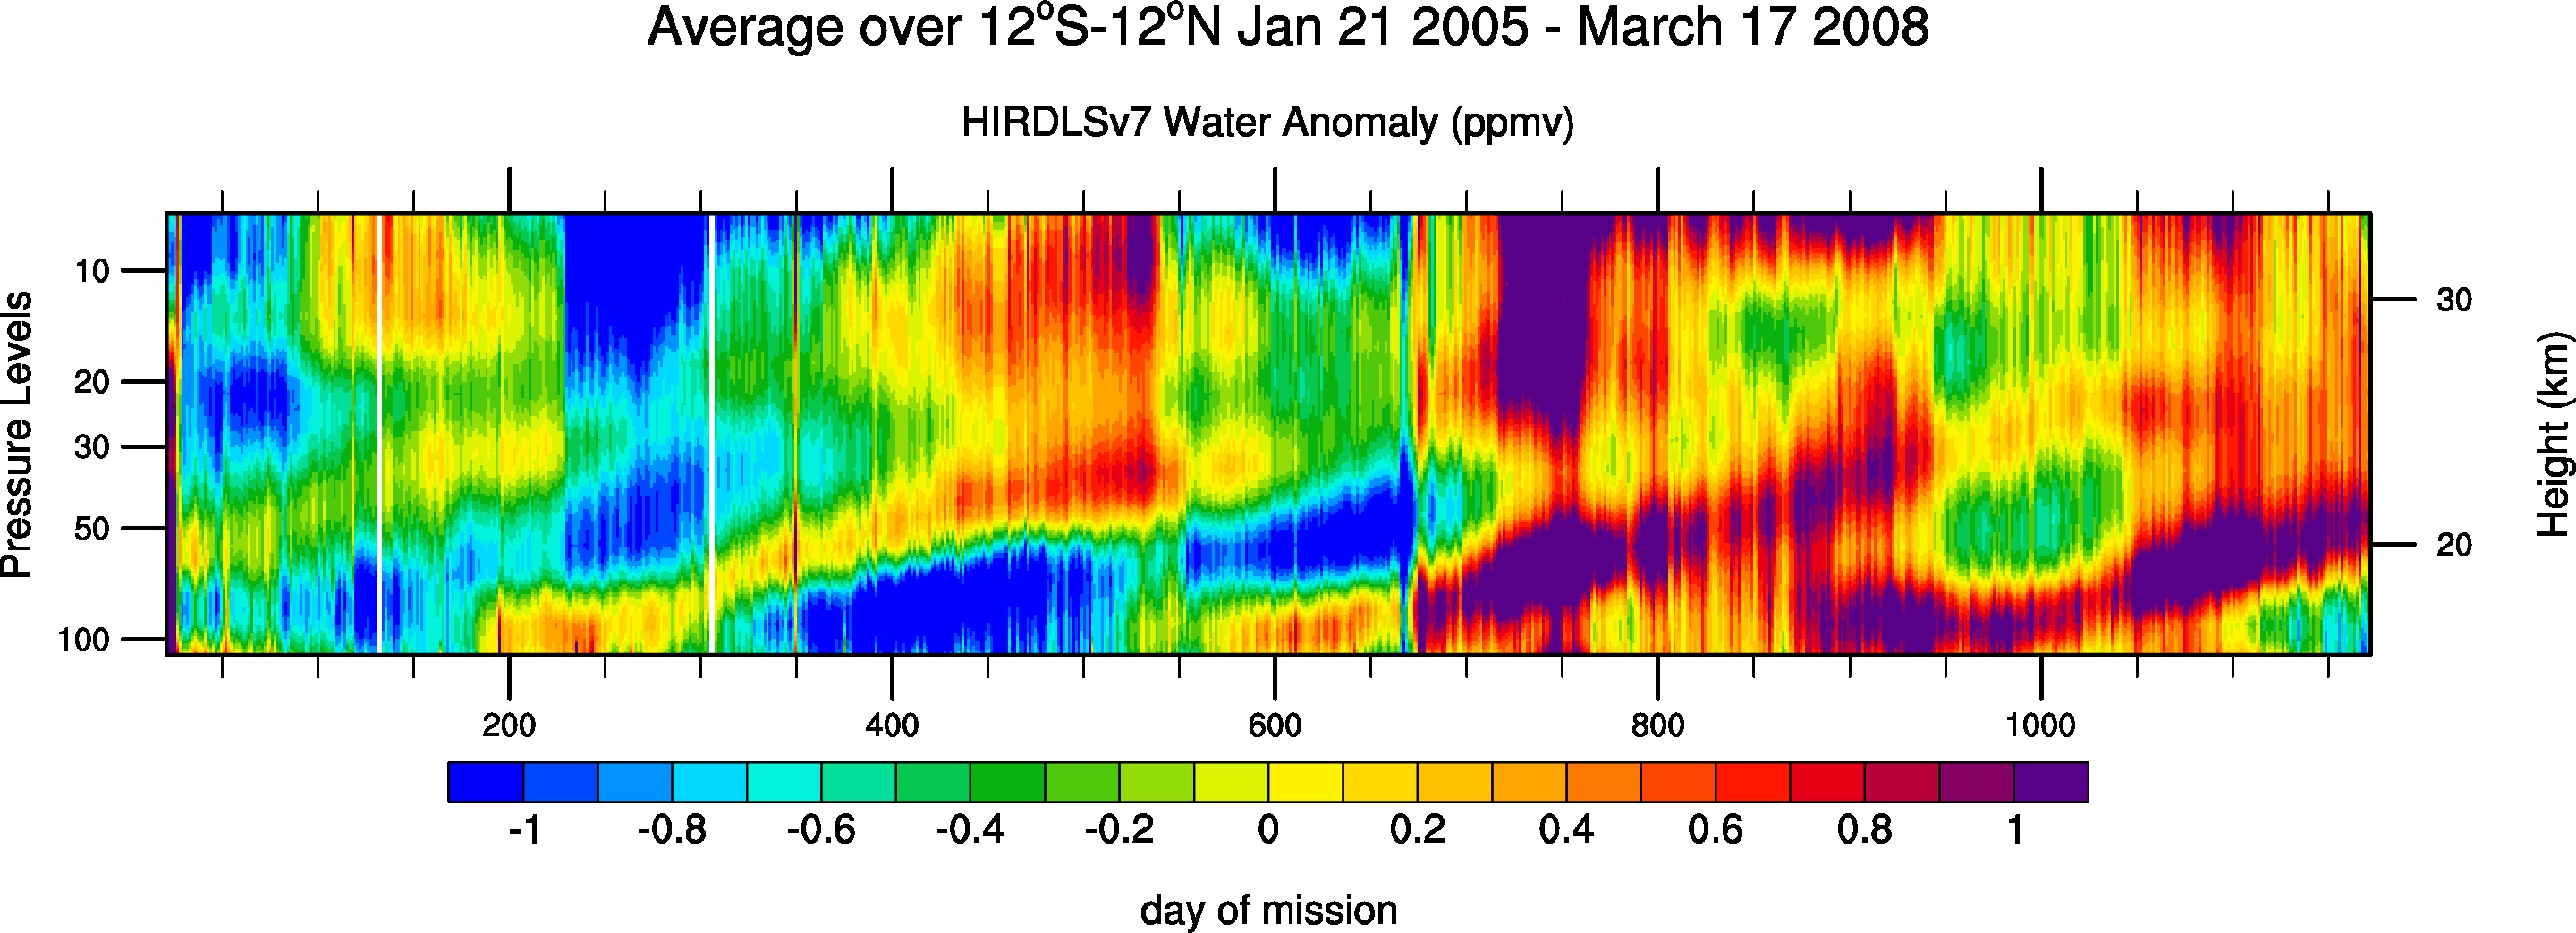
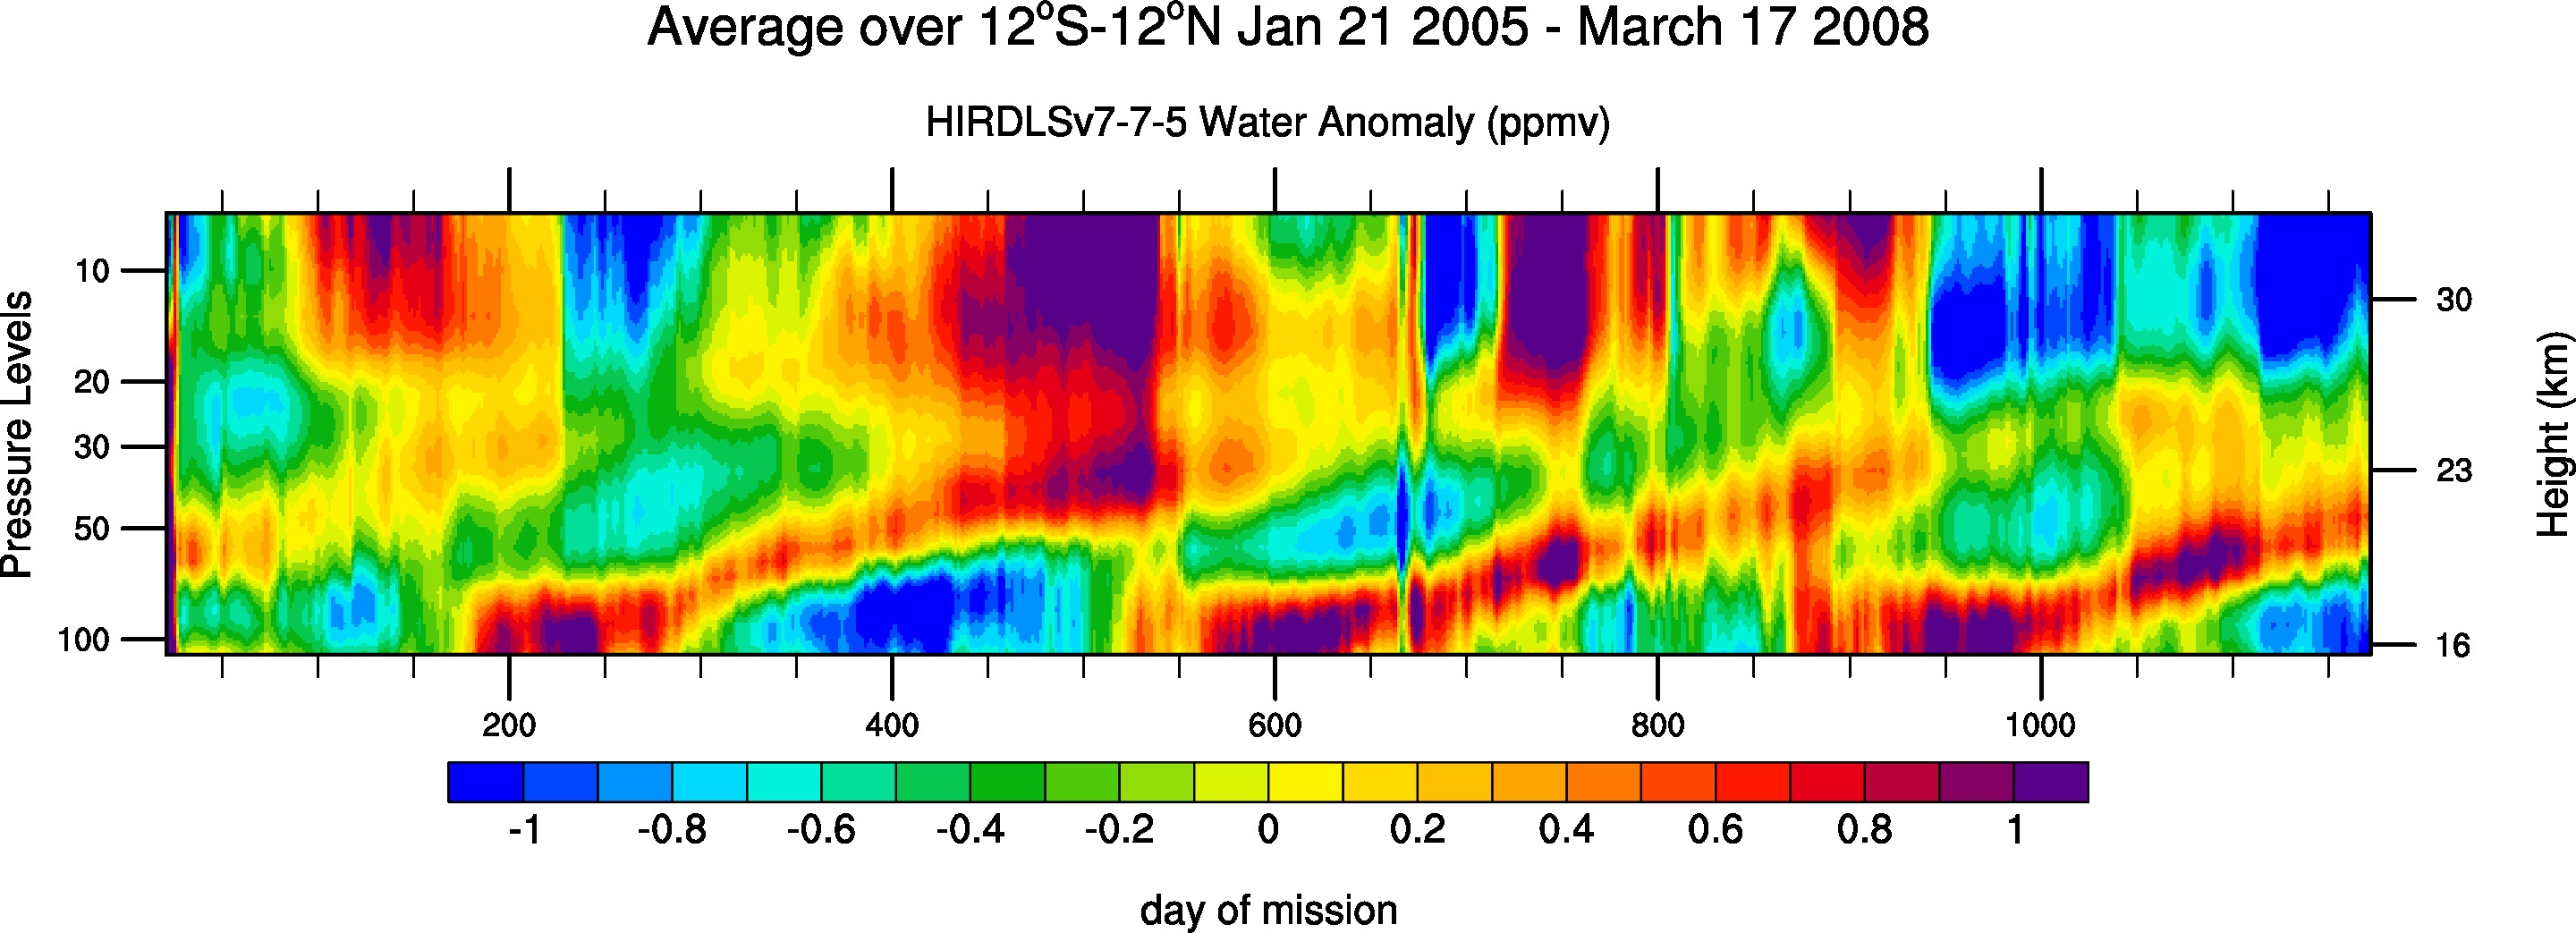
HIRDLS Test 'Tape-Recorder' Water plots:
HIRDLS Test 'Tape-Recorder' ClONO2 plots:
HIRDLS Test 'Tape-Recorder' N2O5 plots:
HIRDLS V.7 zonal mean plots for 2005-2007:
- Temperature Combined (pdf)
- CFC11 Combined (pdf) , CFC12
Combined (pdf)
- Ozone: Combined (pdf),
Ascending (pdf),
Descending (pdf)
- Water (these are all now V.7-00-05) Combined (pdf), Ascending (pdf),Descending (pdf),
H2O-20 Combined (pdf), Ascending (pdf),Descending (pdf)
- NO2: Ascending (pdf),
Descending (pdf),
NO2 down scans: Ascending down(pdf),
Descending down(pdf)
Special test NO2 down scans: Ascending down(pdf), Descending down(pdf)
- N2O5: Ascending (pdf),
Descending (pdf)
- ClONO2: Ascending (pdf),
Descending (pdf)
- HNO3 Combined (pdf)
- N2O Combined (pdf)
- Extinctions:
Test HIRDLS V.7-00-05 zonal mean plots for 2005-2007:
HIRDLS V.6 zonal mean plots for 2005-2007:
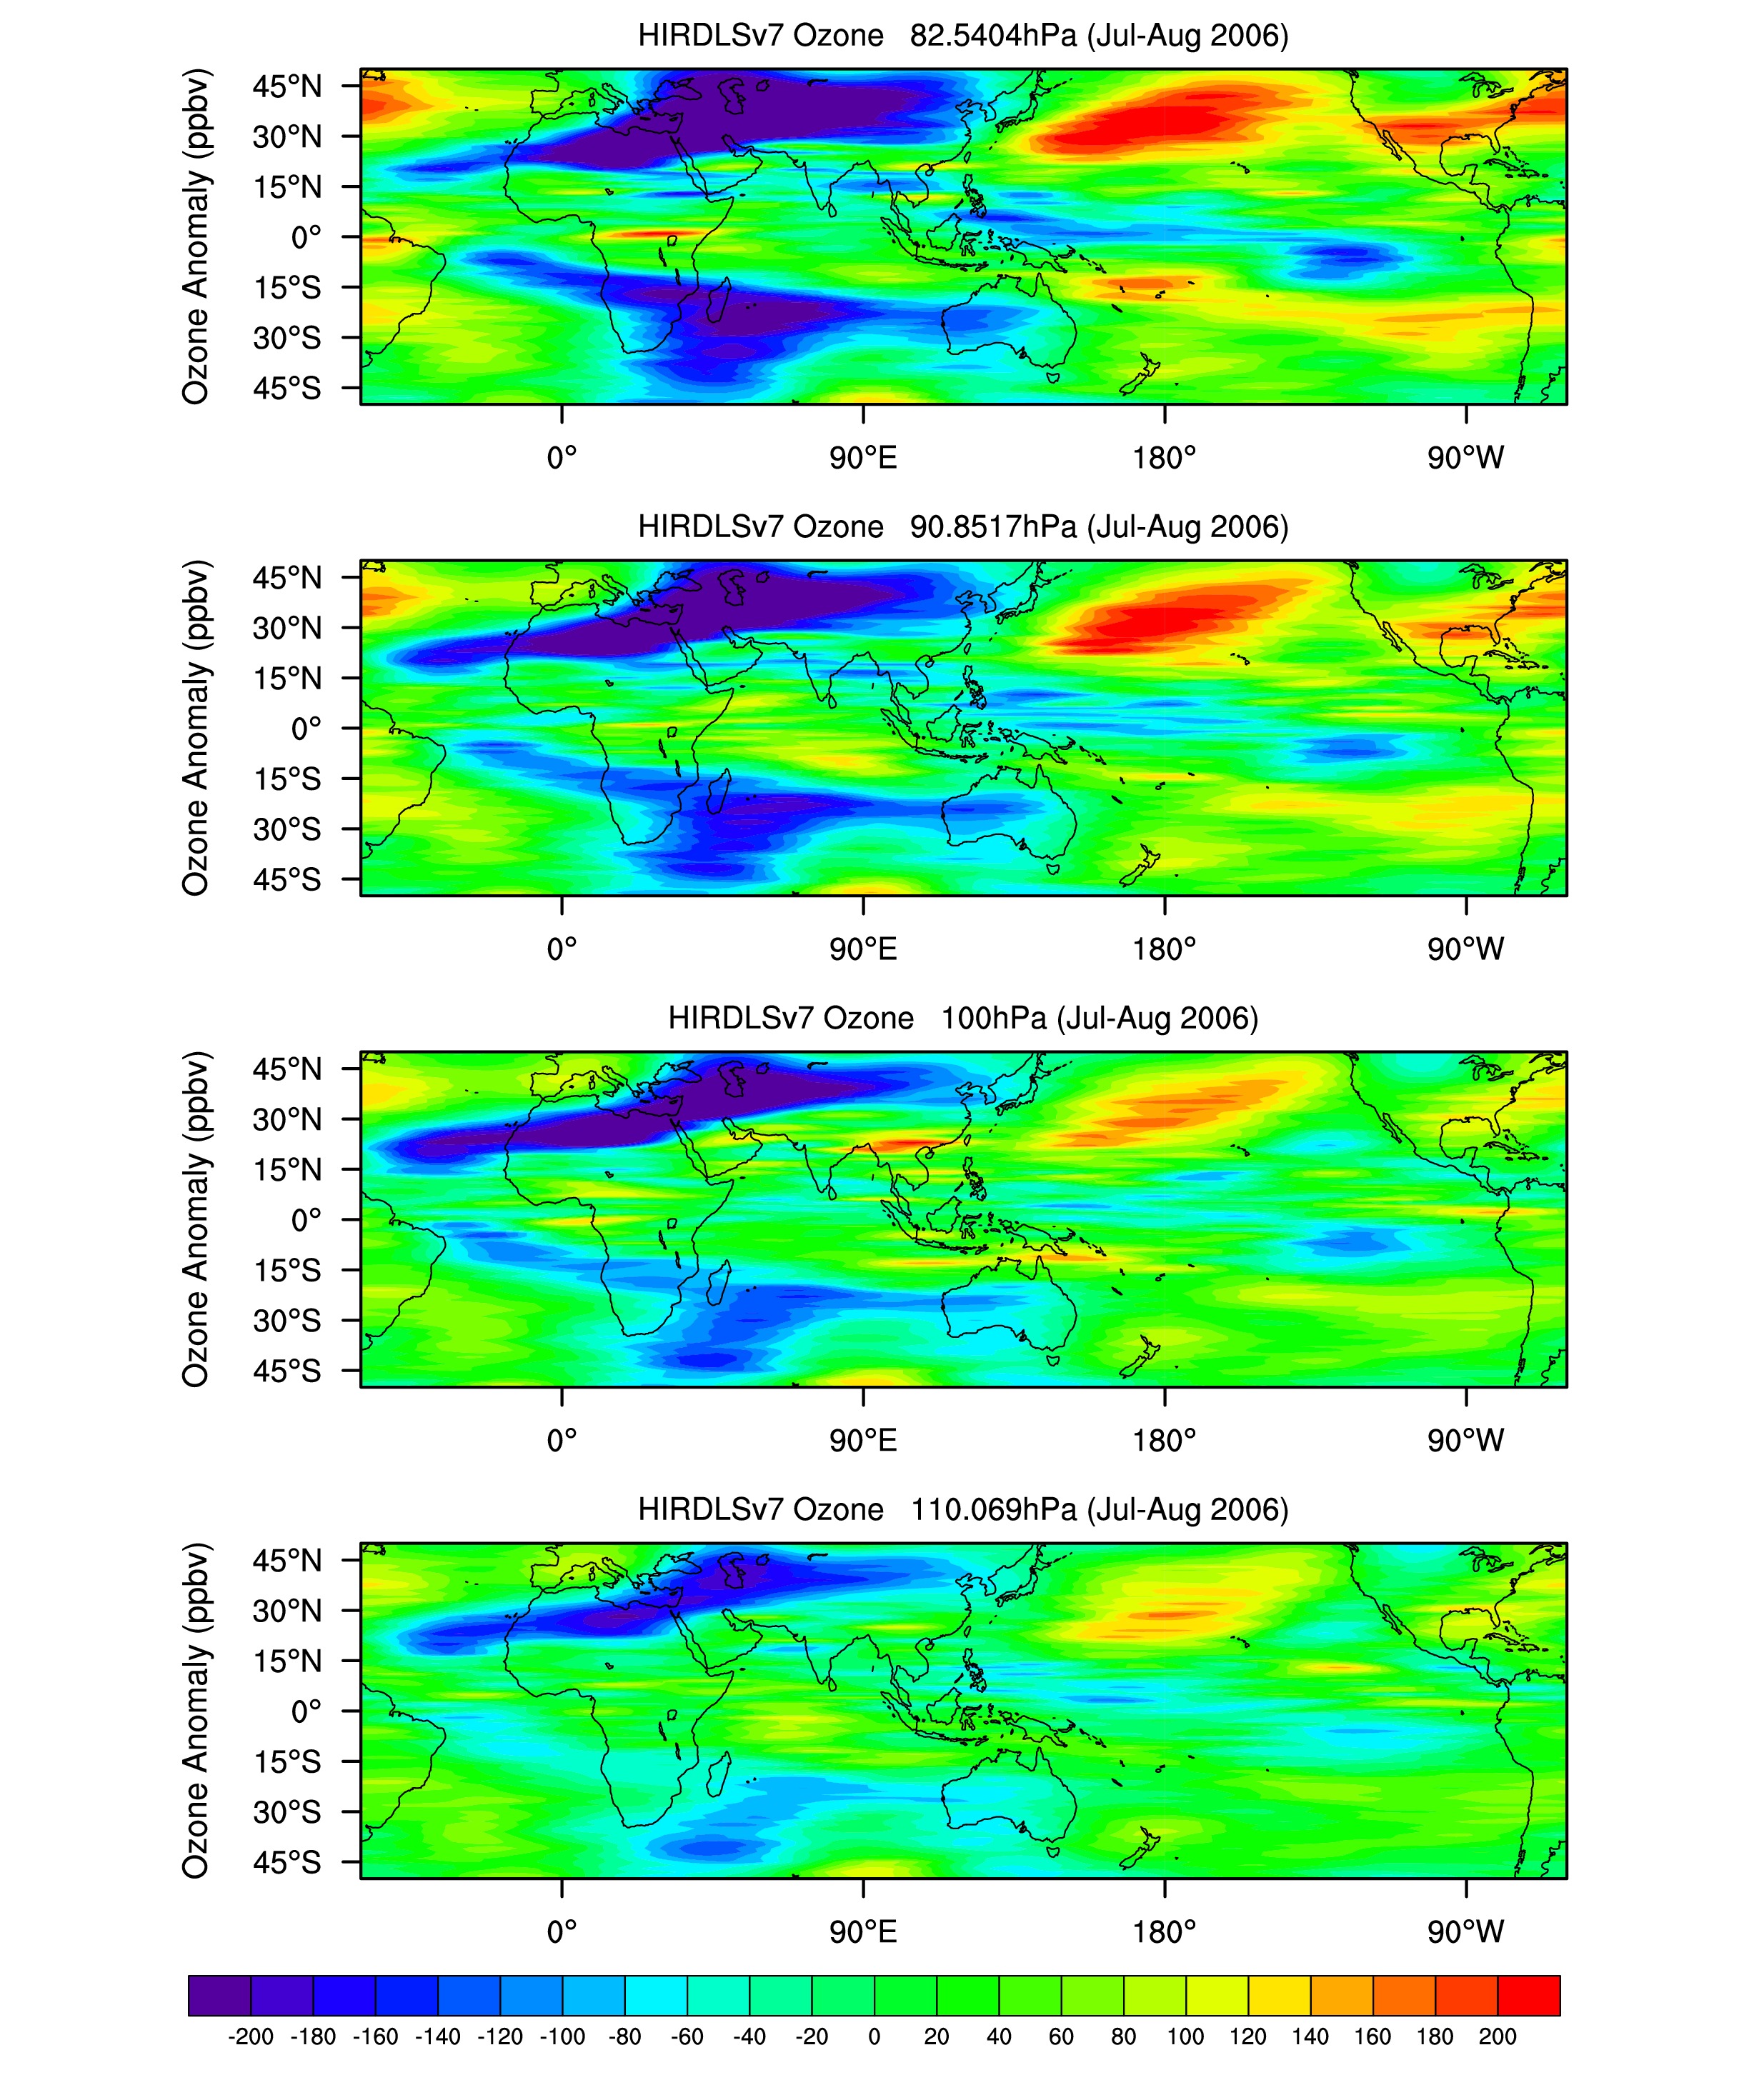
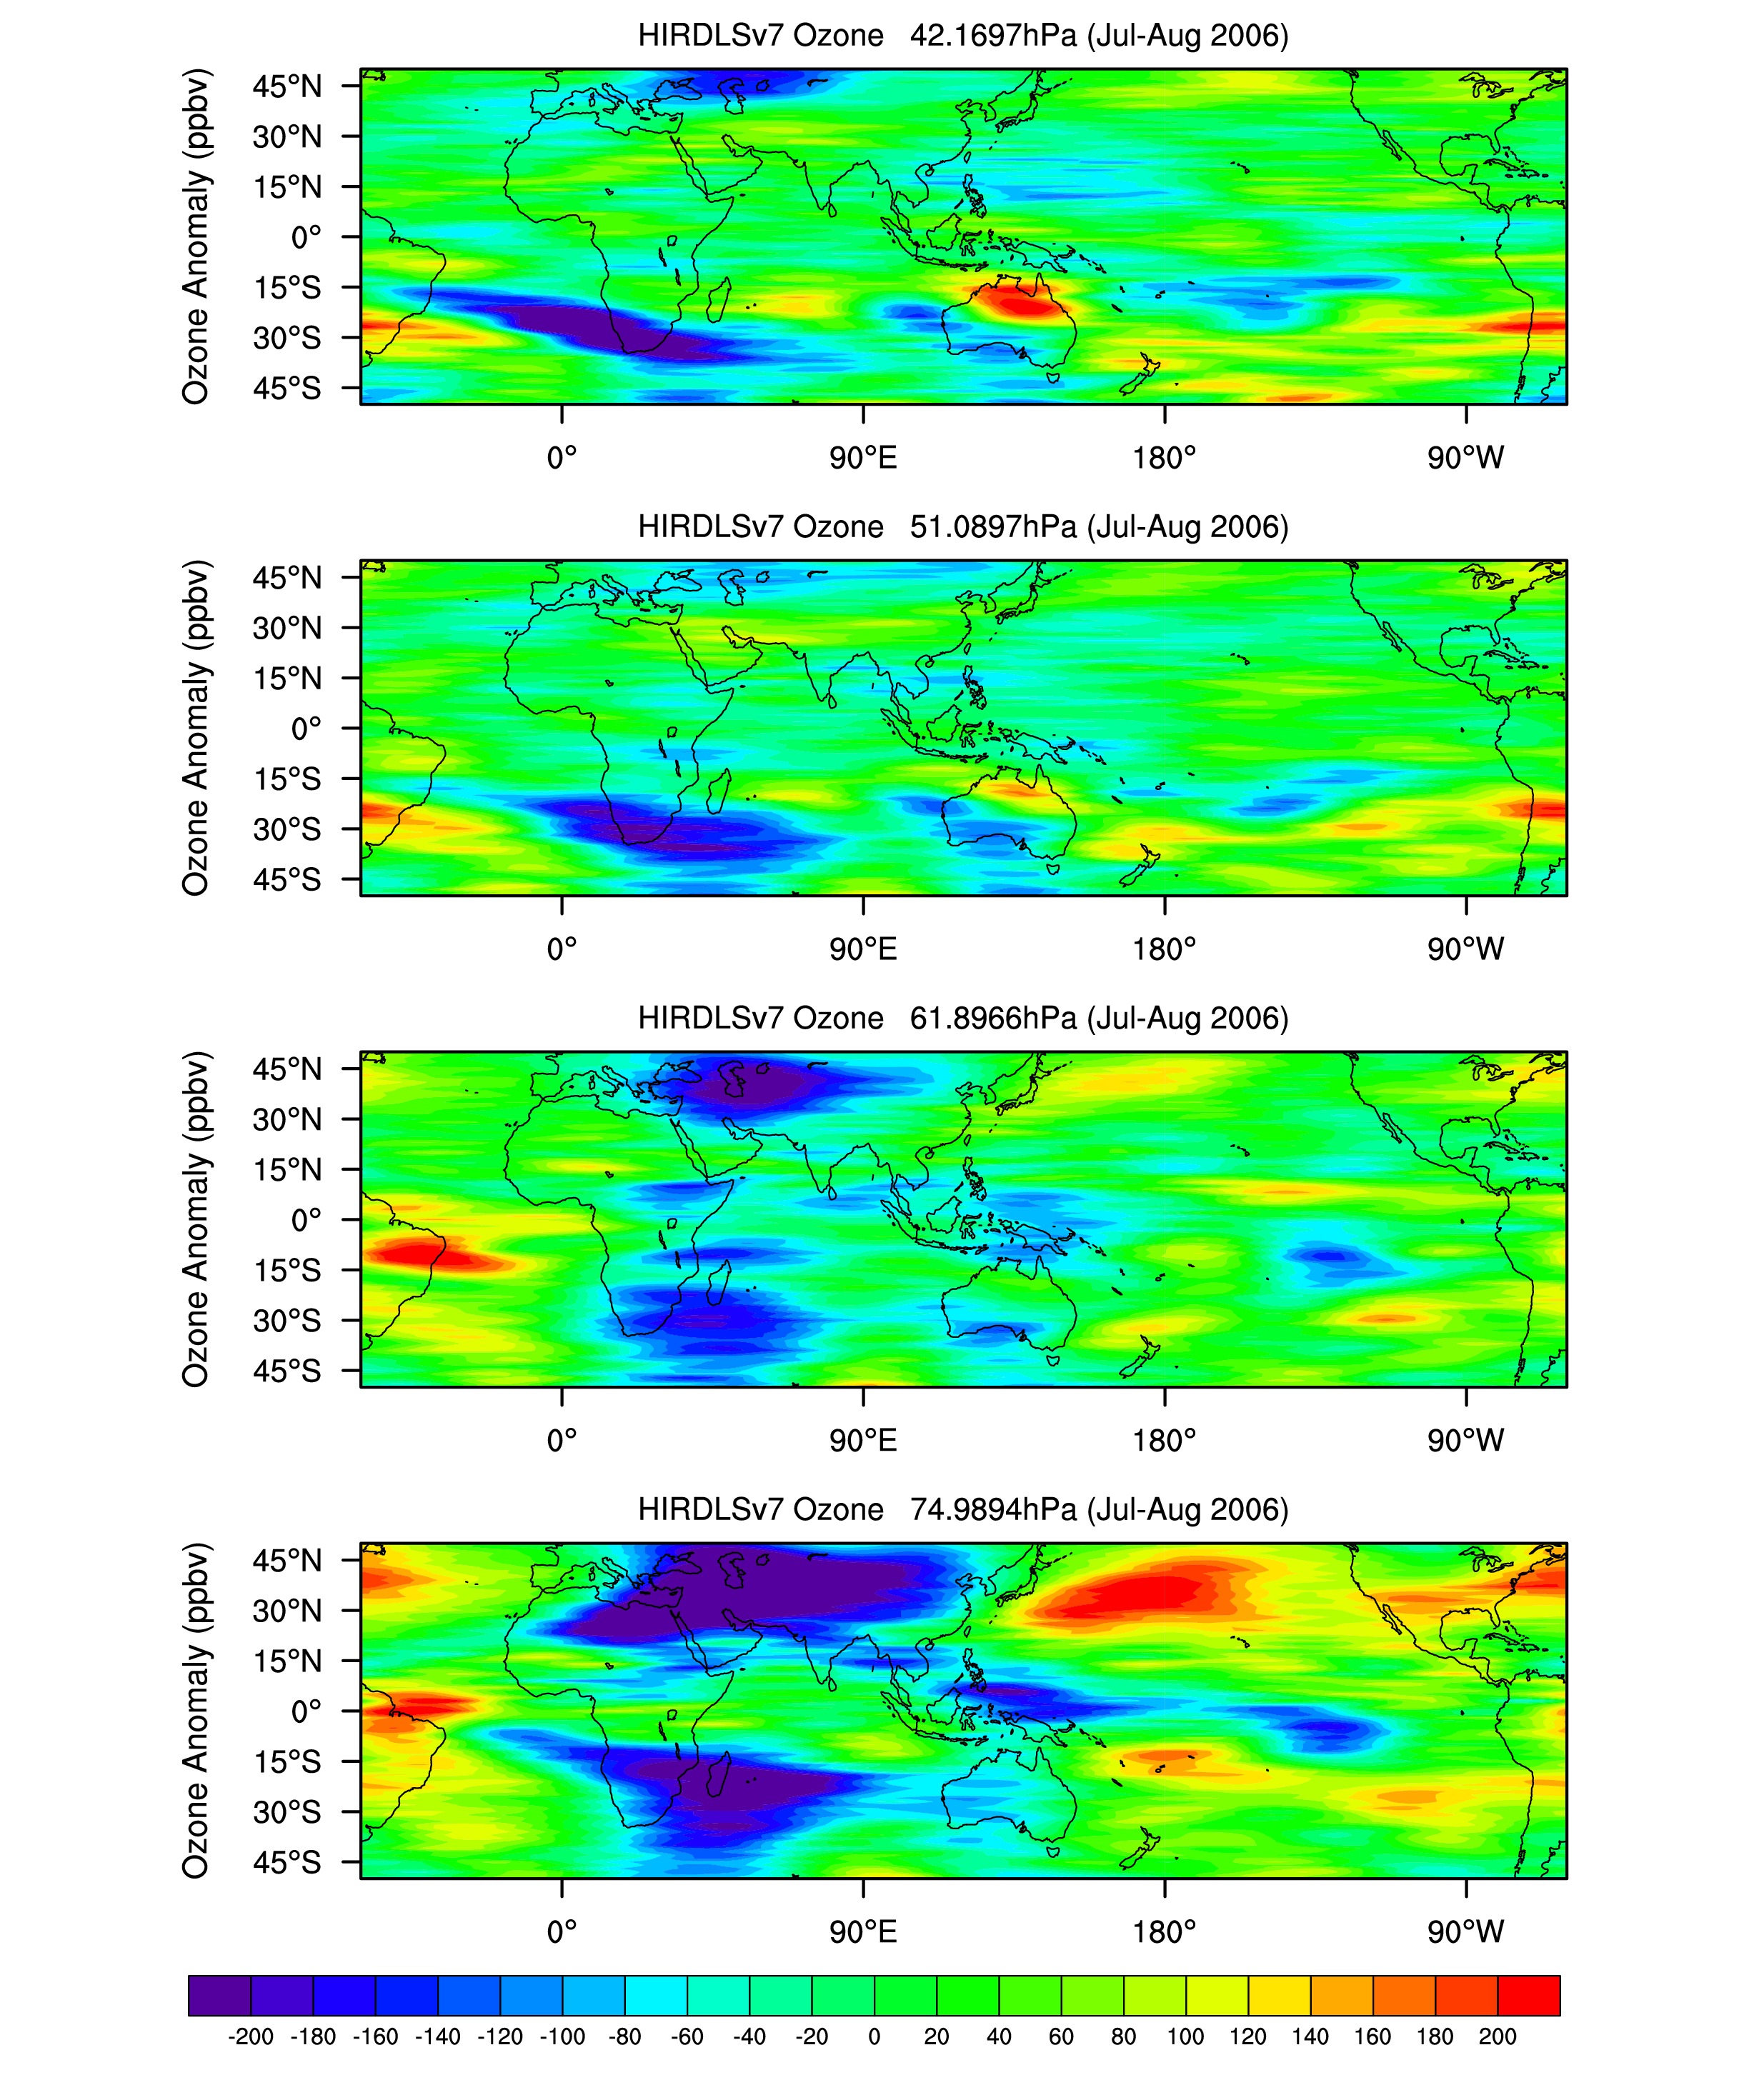
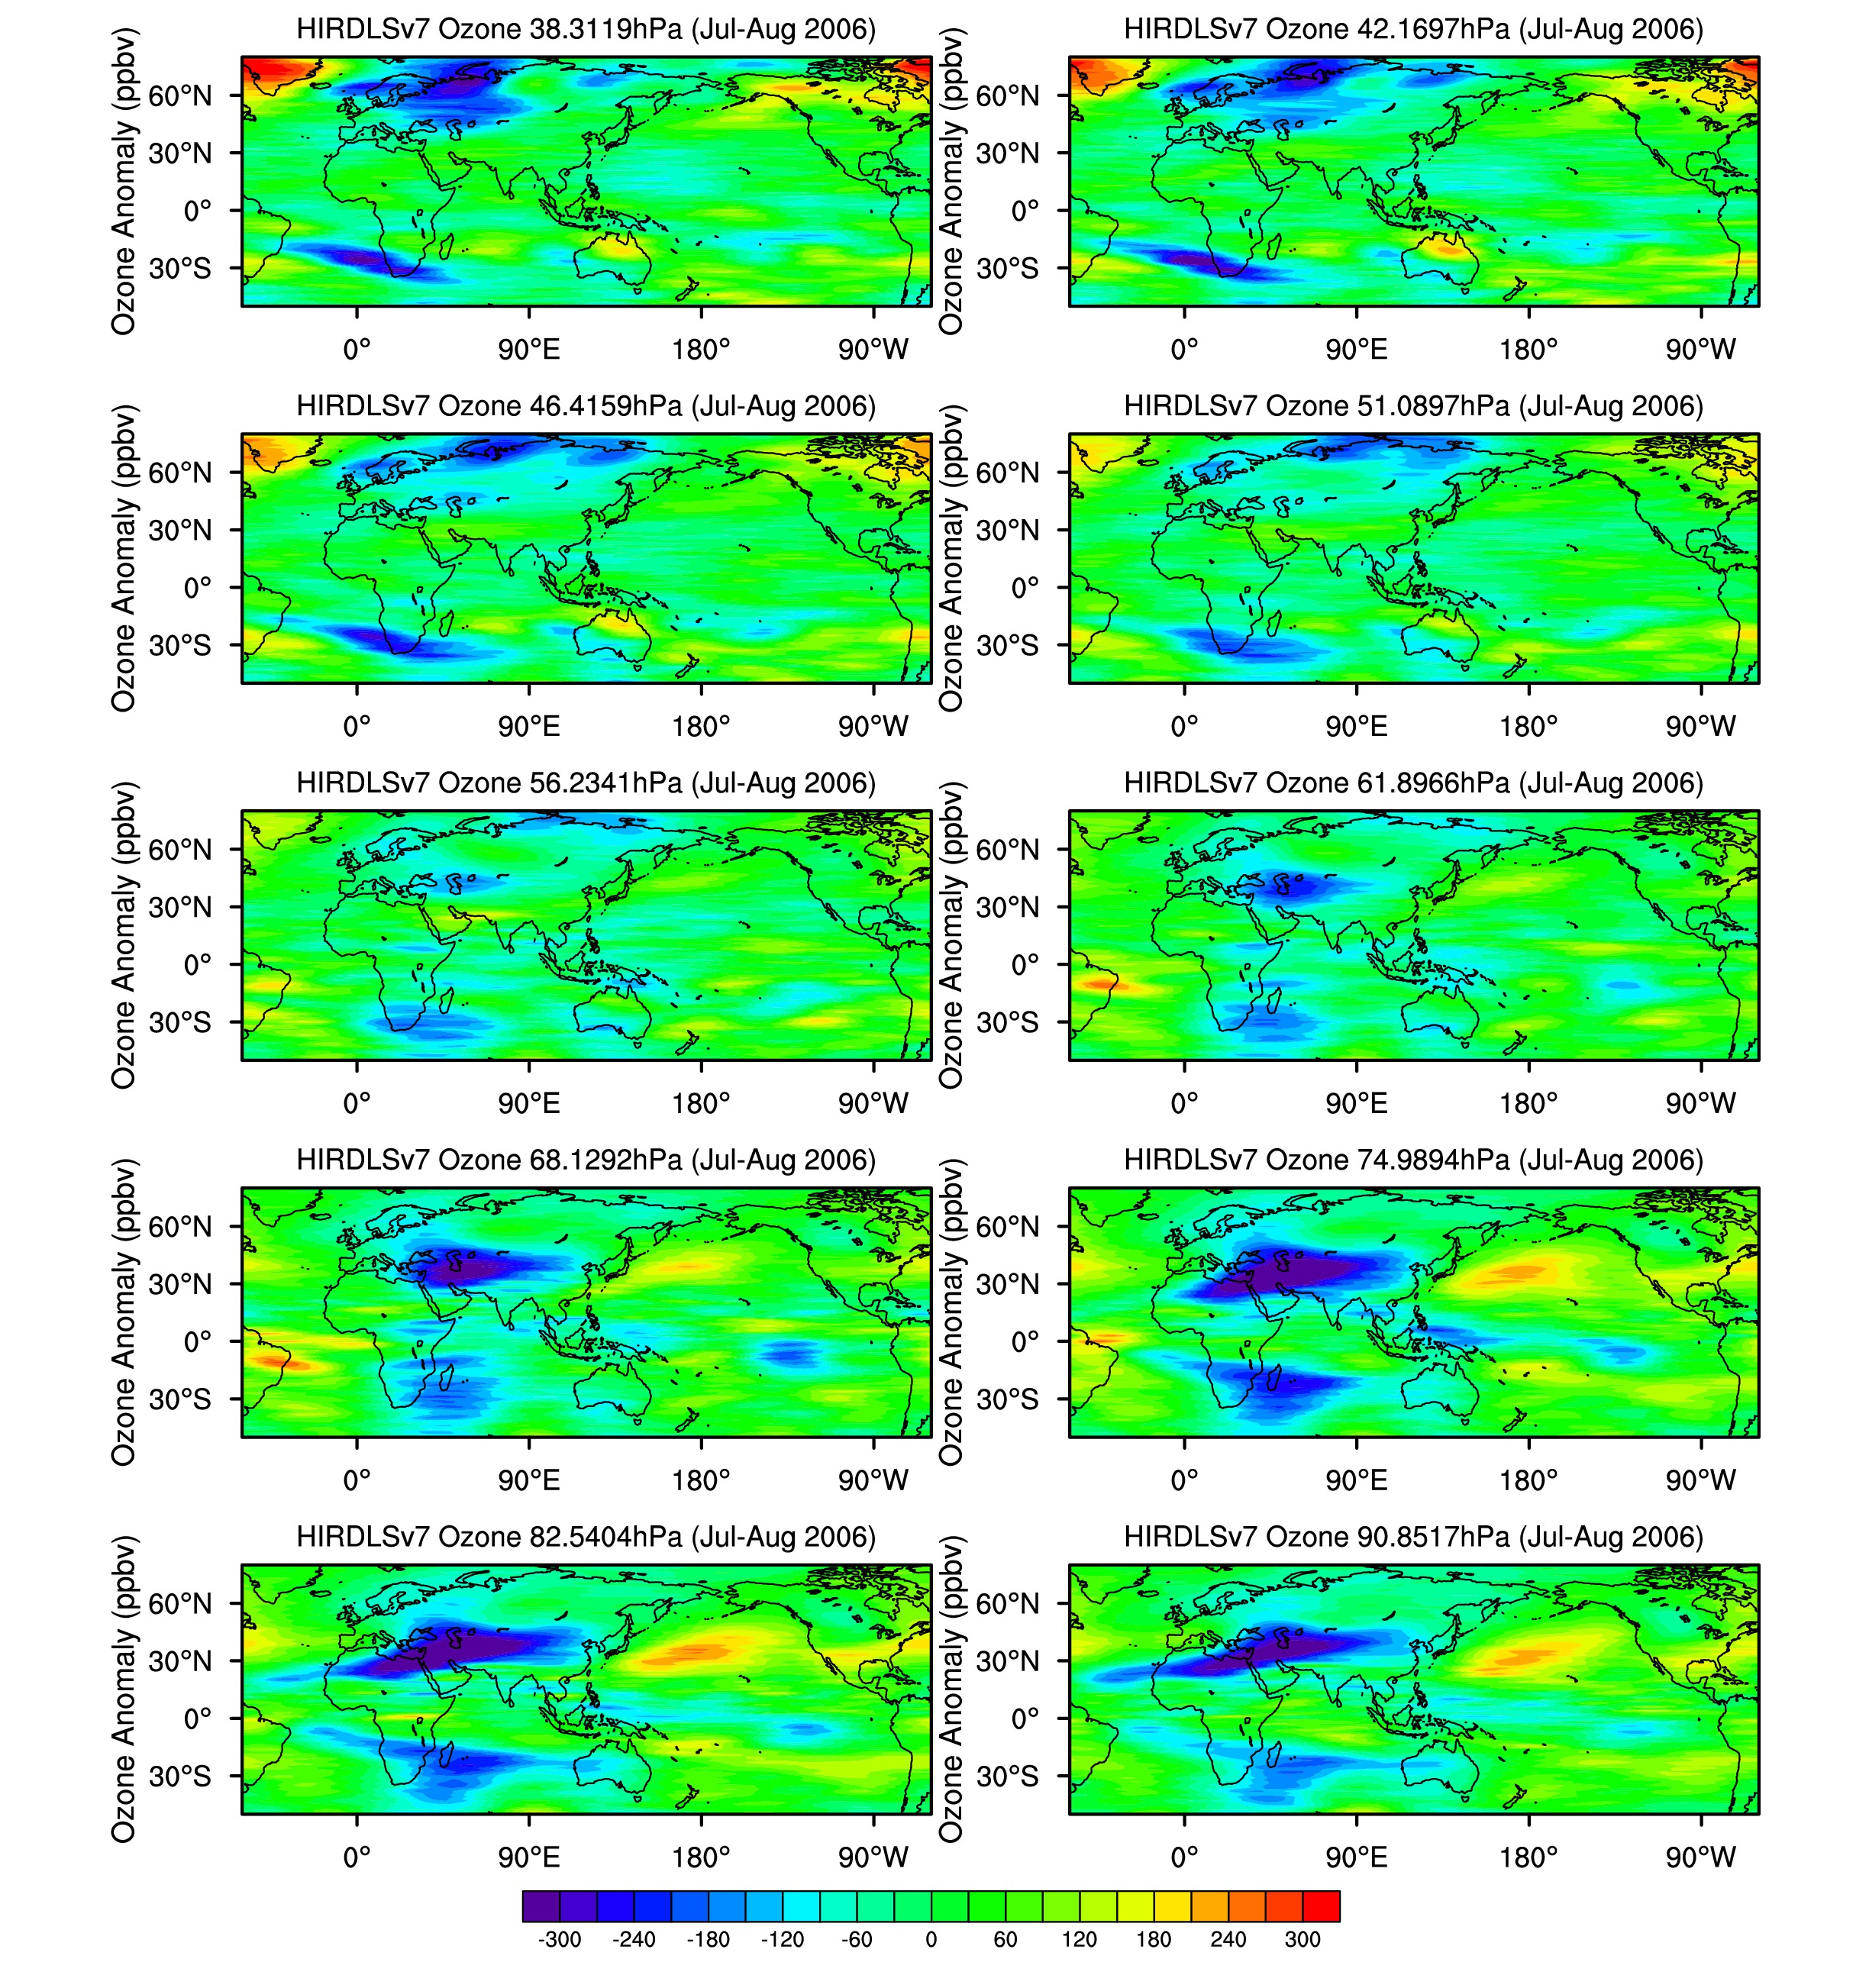
Evidence for Asian Monsoon via HIRDLS V.6 data:
- HIRDLS V.6 maps for mean July-August, different levels:
- GPH 83-110mb: '05, '06, '07,GPH Anomalies 83-110mb:'05, '06, '07
- Temperature 83-110mb:
'05, '06, '07, 22-133mb: '05, '06, '07
Temperature Anomalies: 42-74mb: '06,83-110mb:'05, '06,[preliminary V7:'06], '07,
121-215mb: '06.
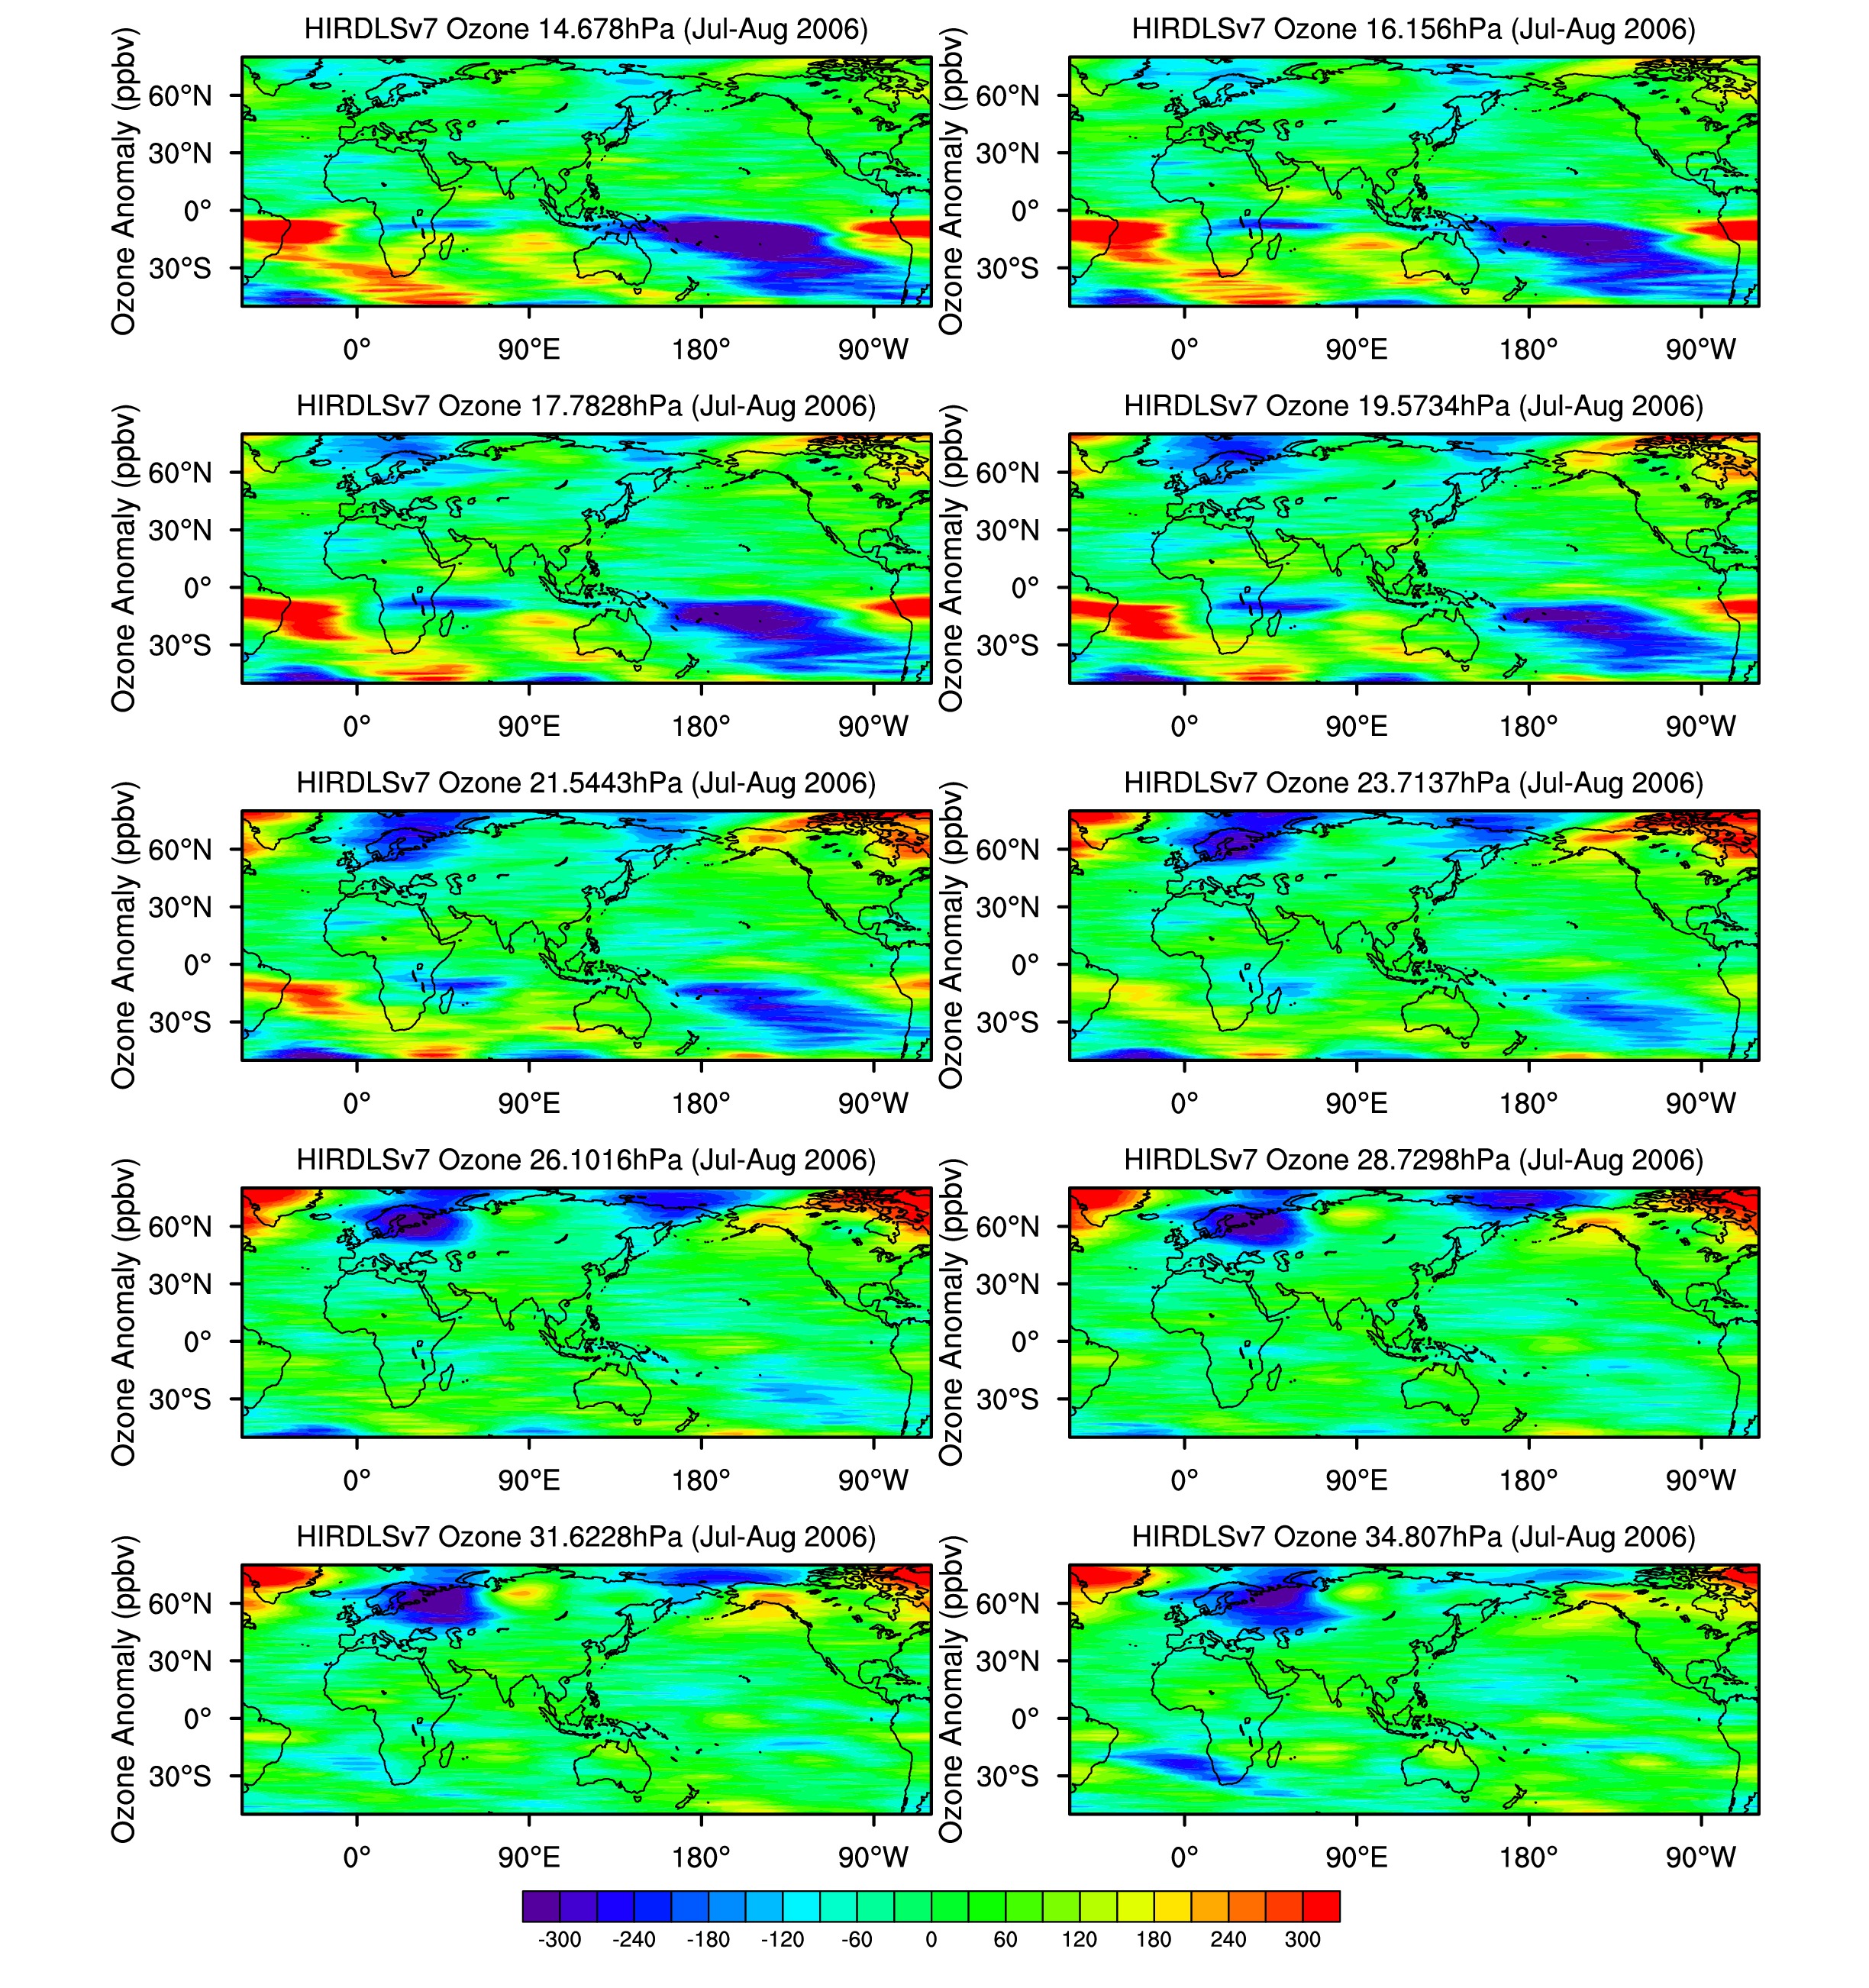
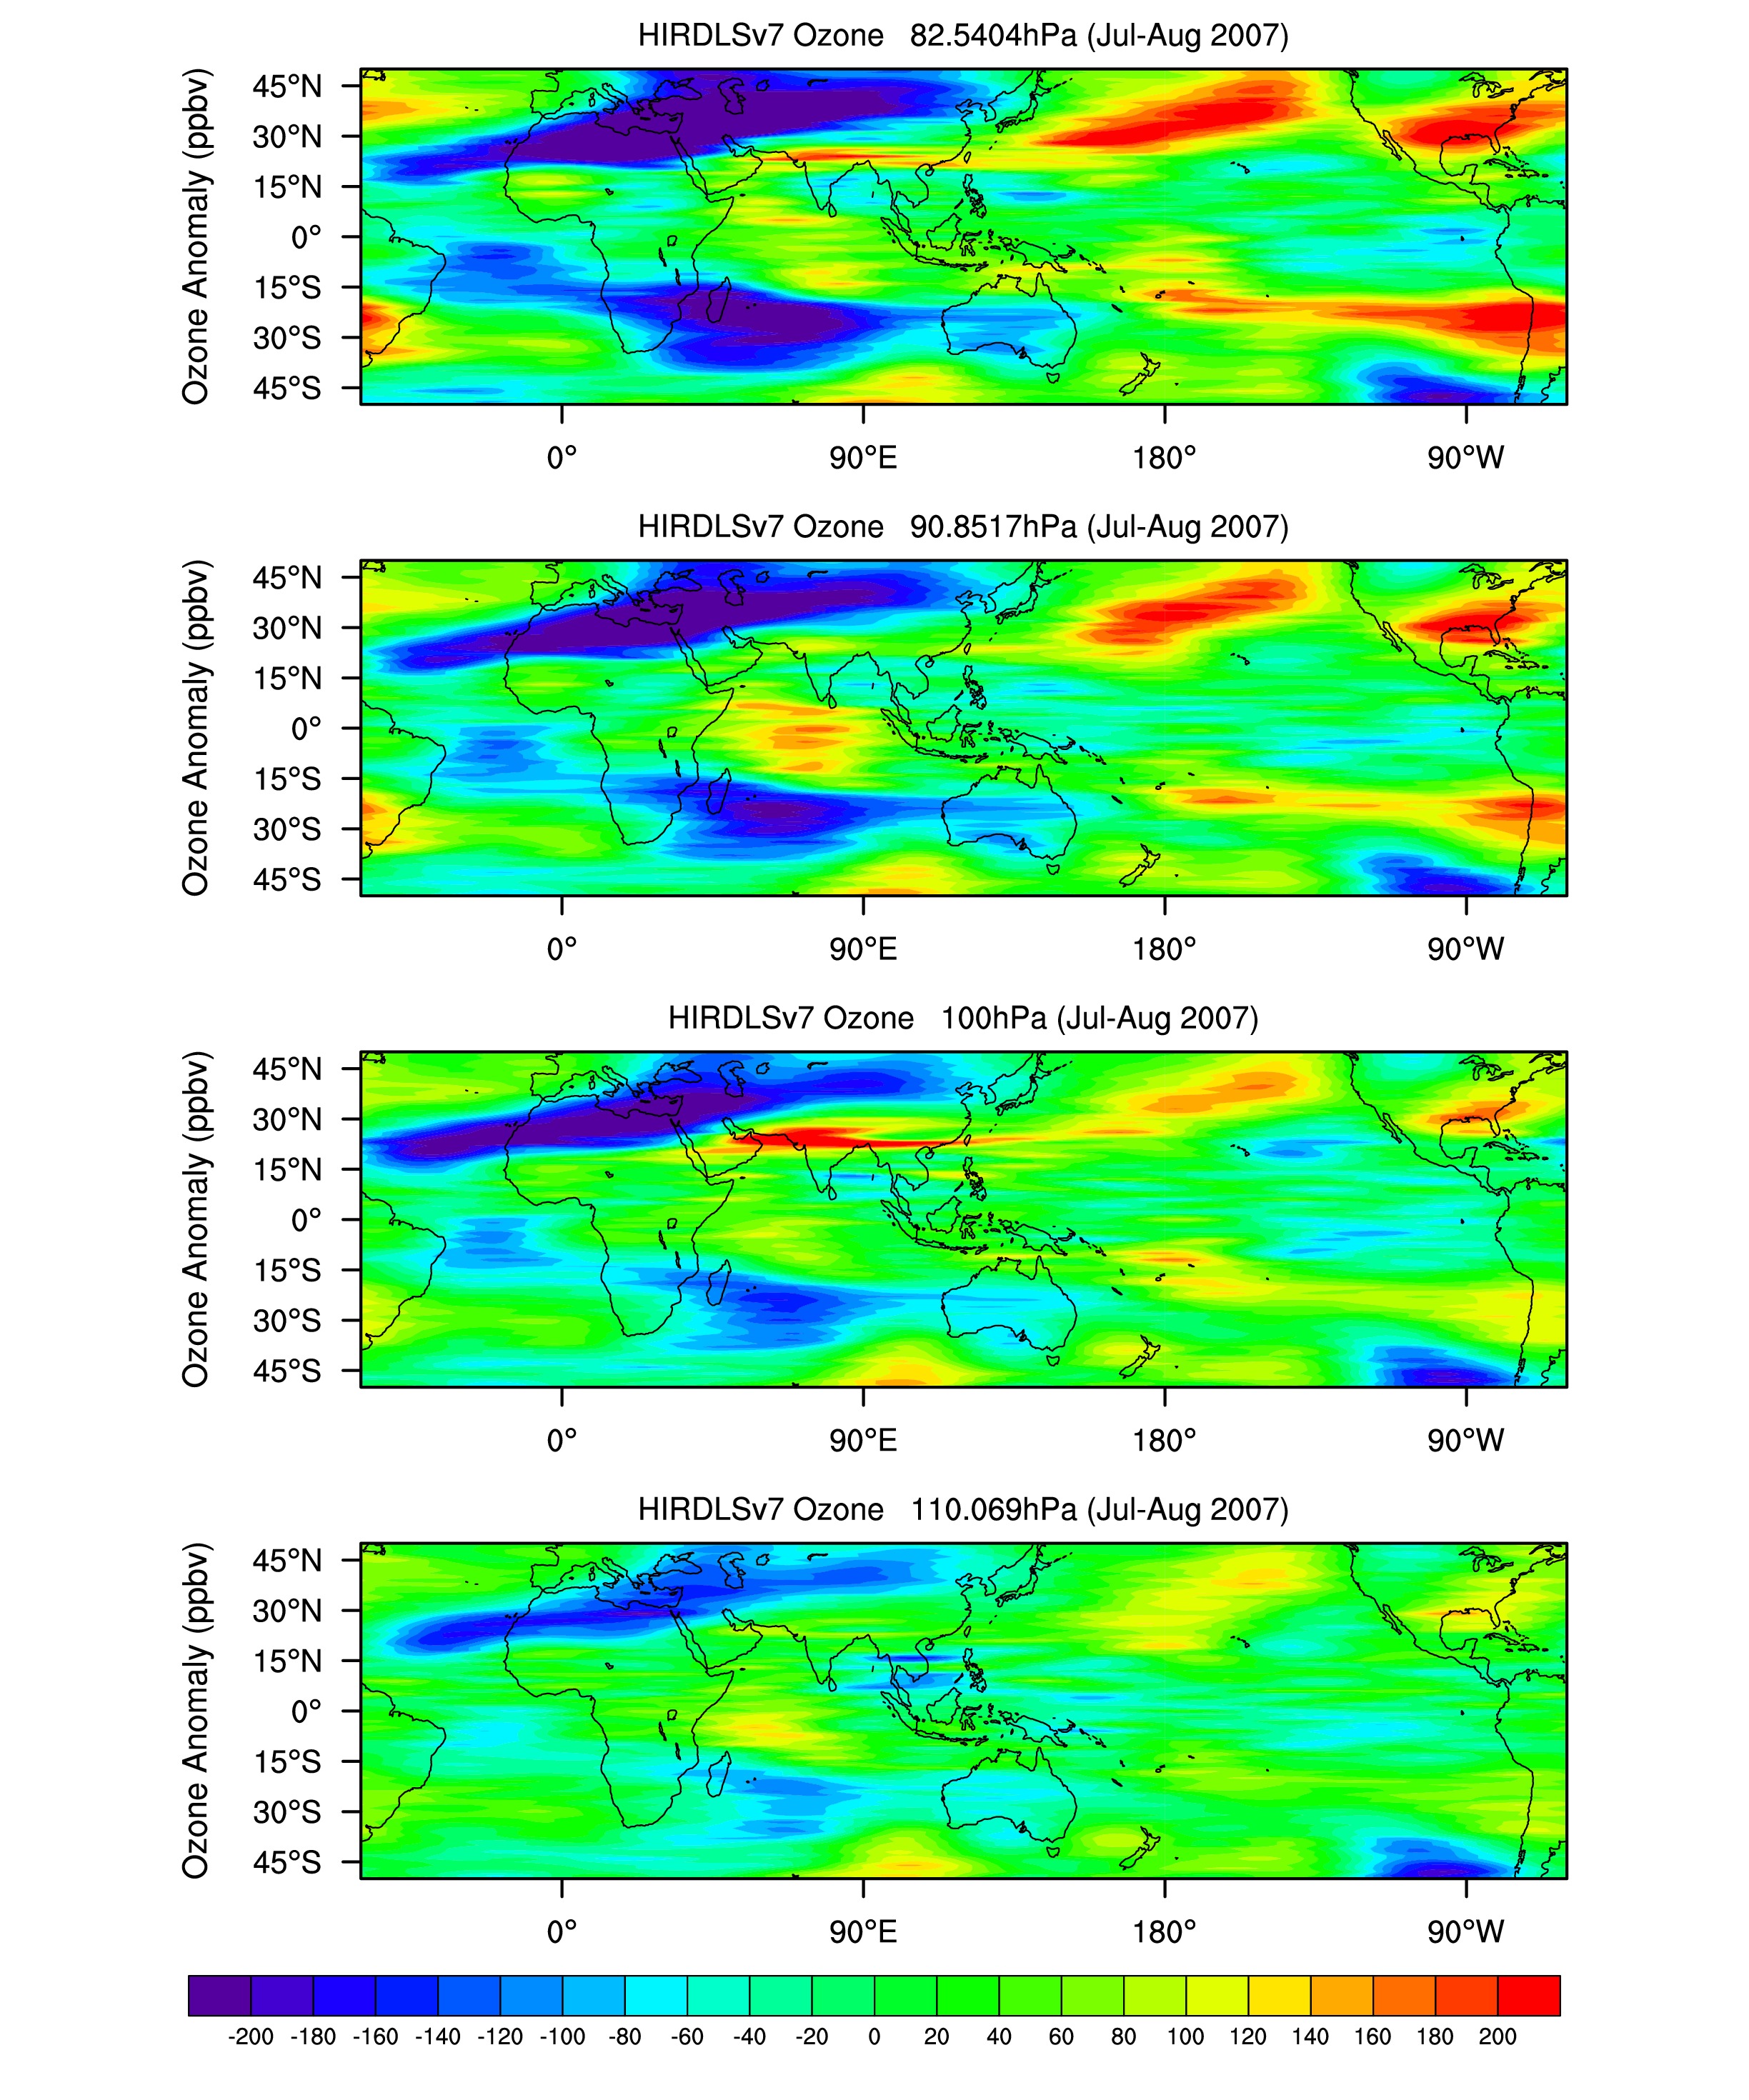
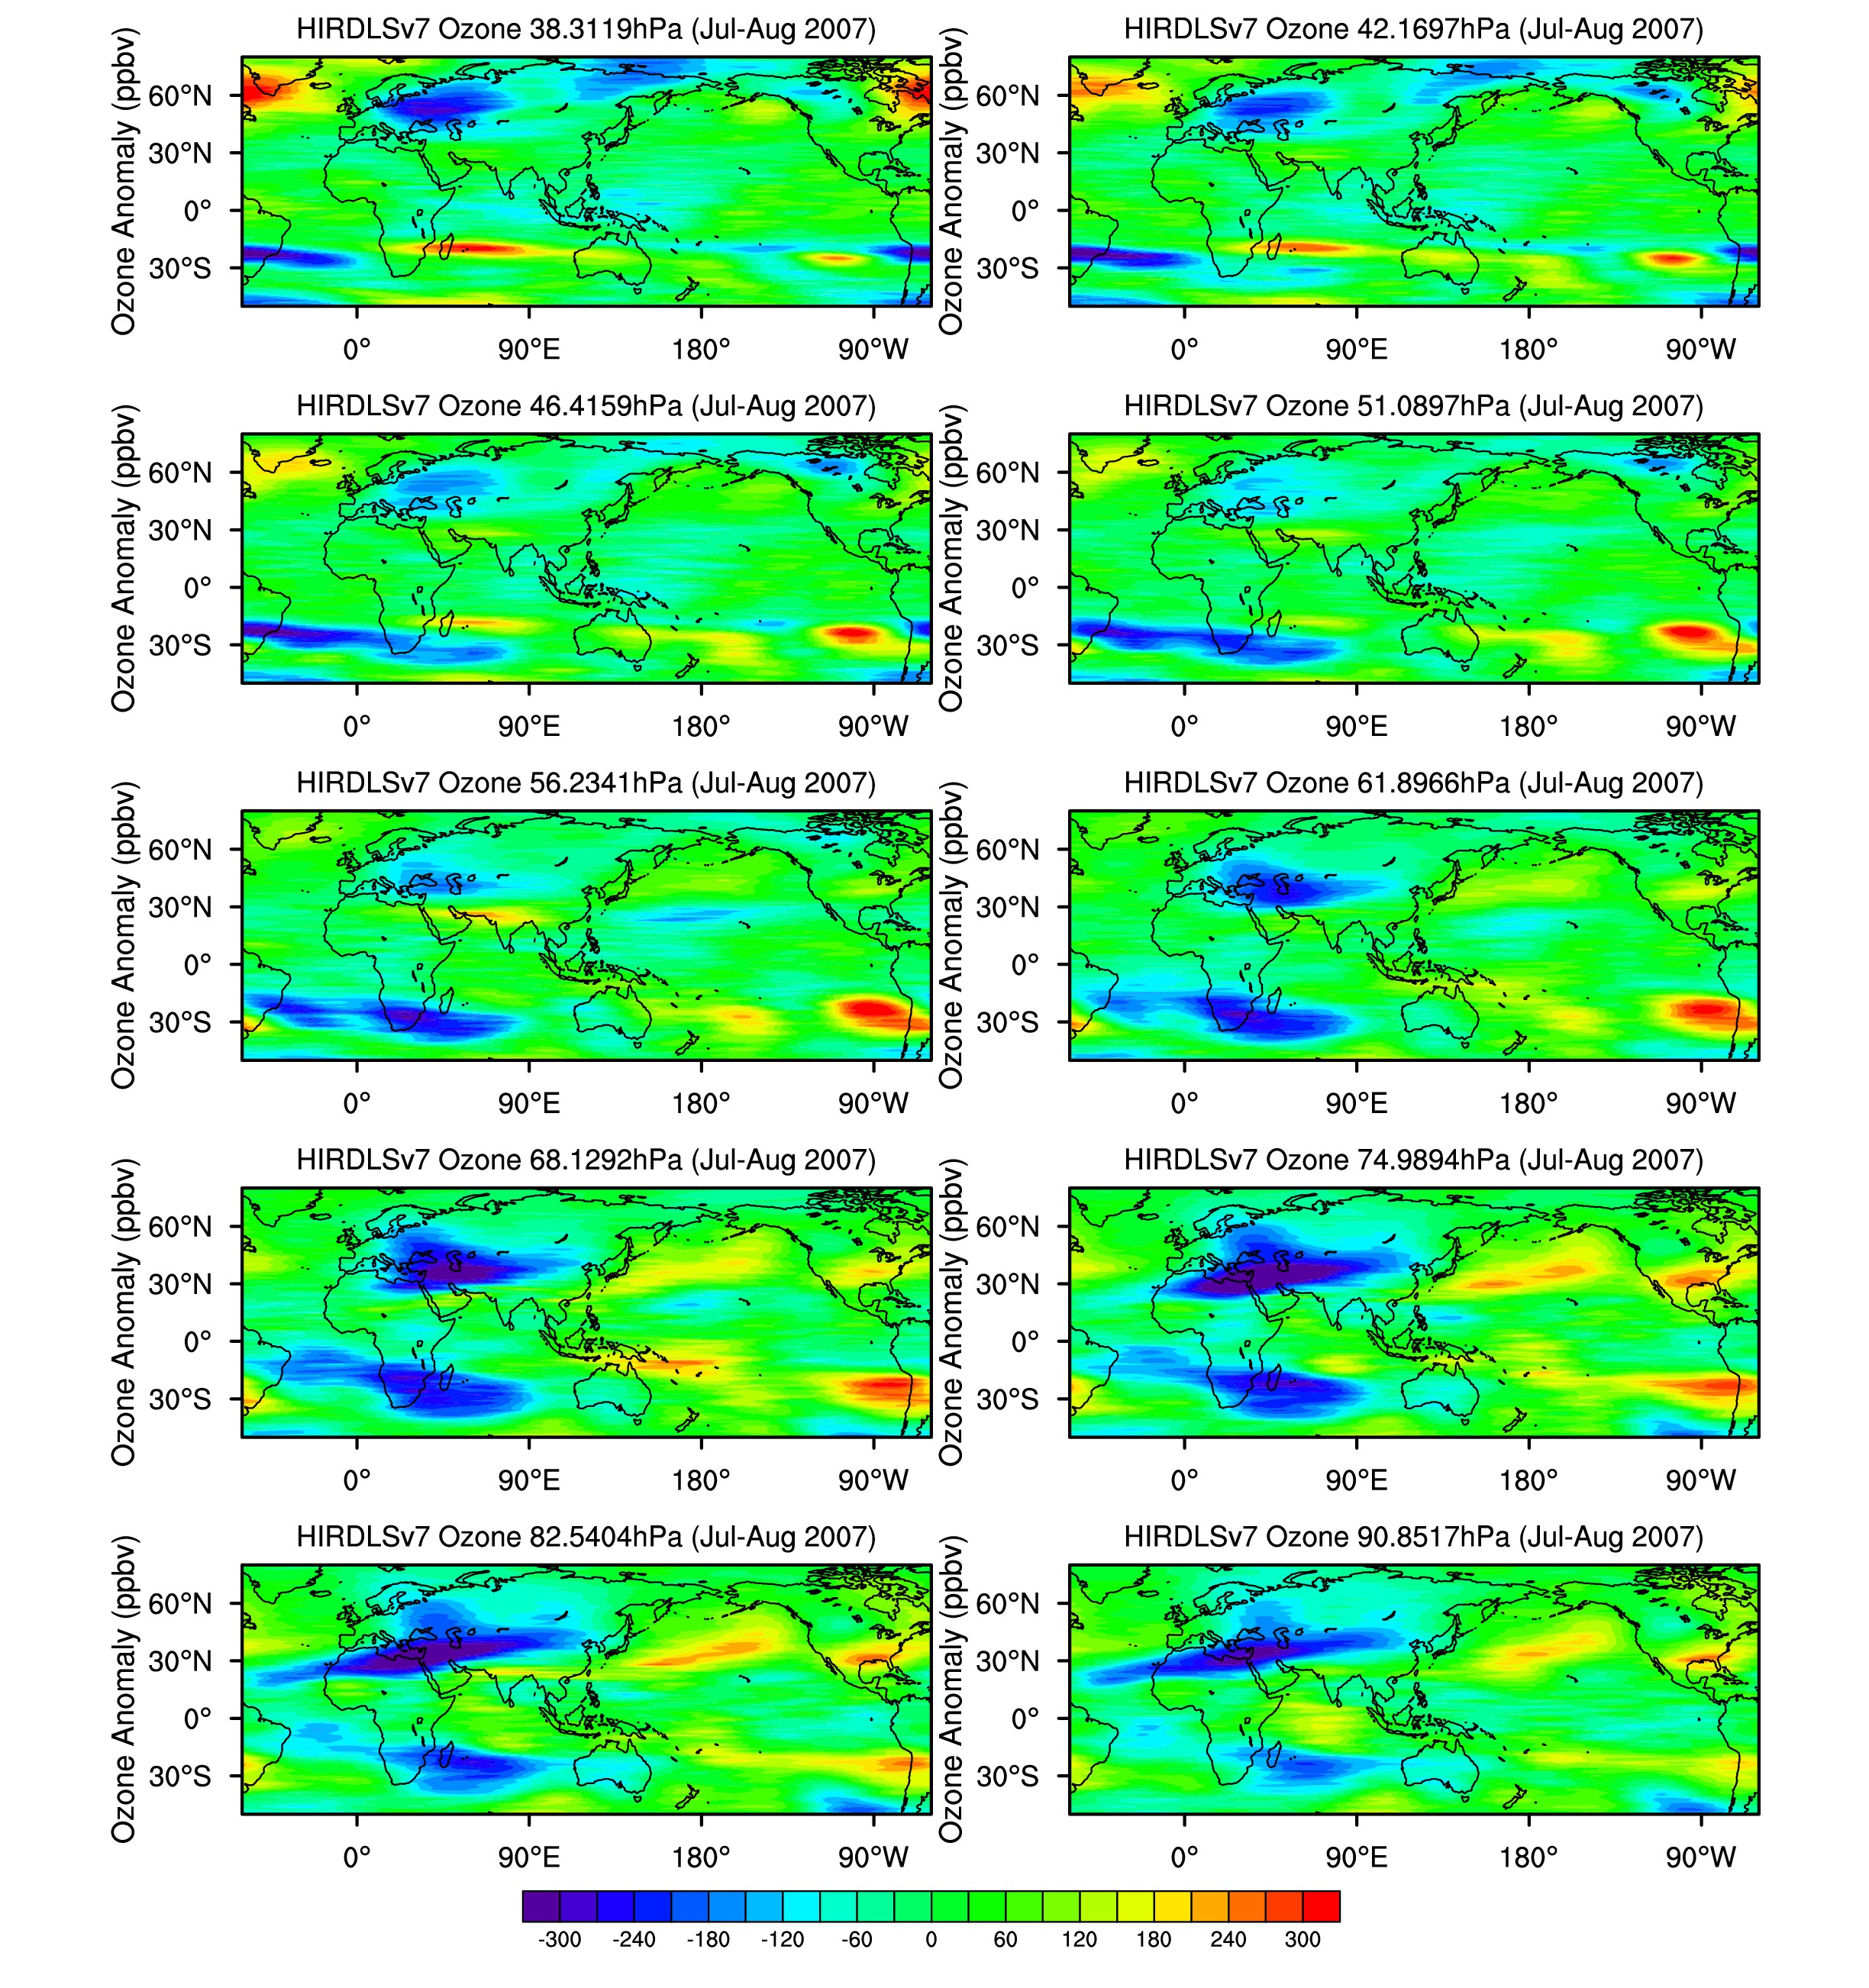
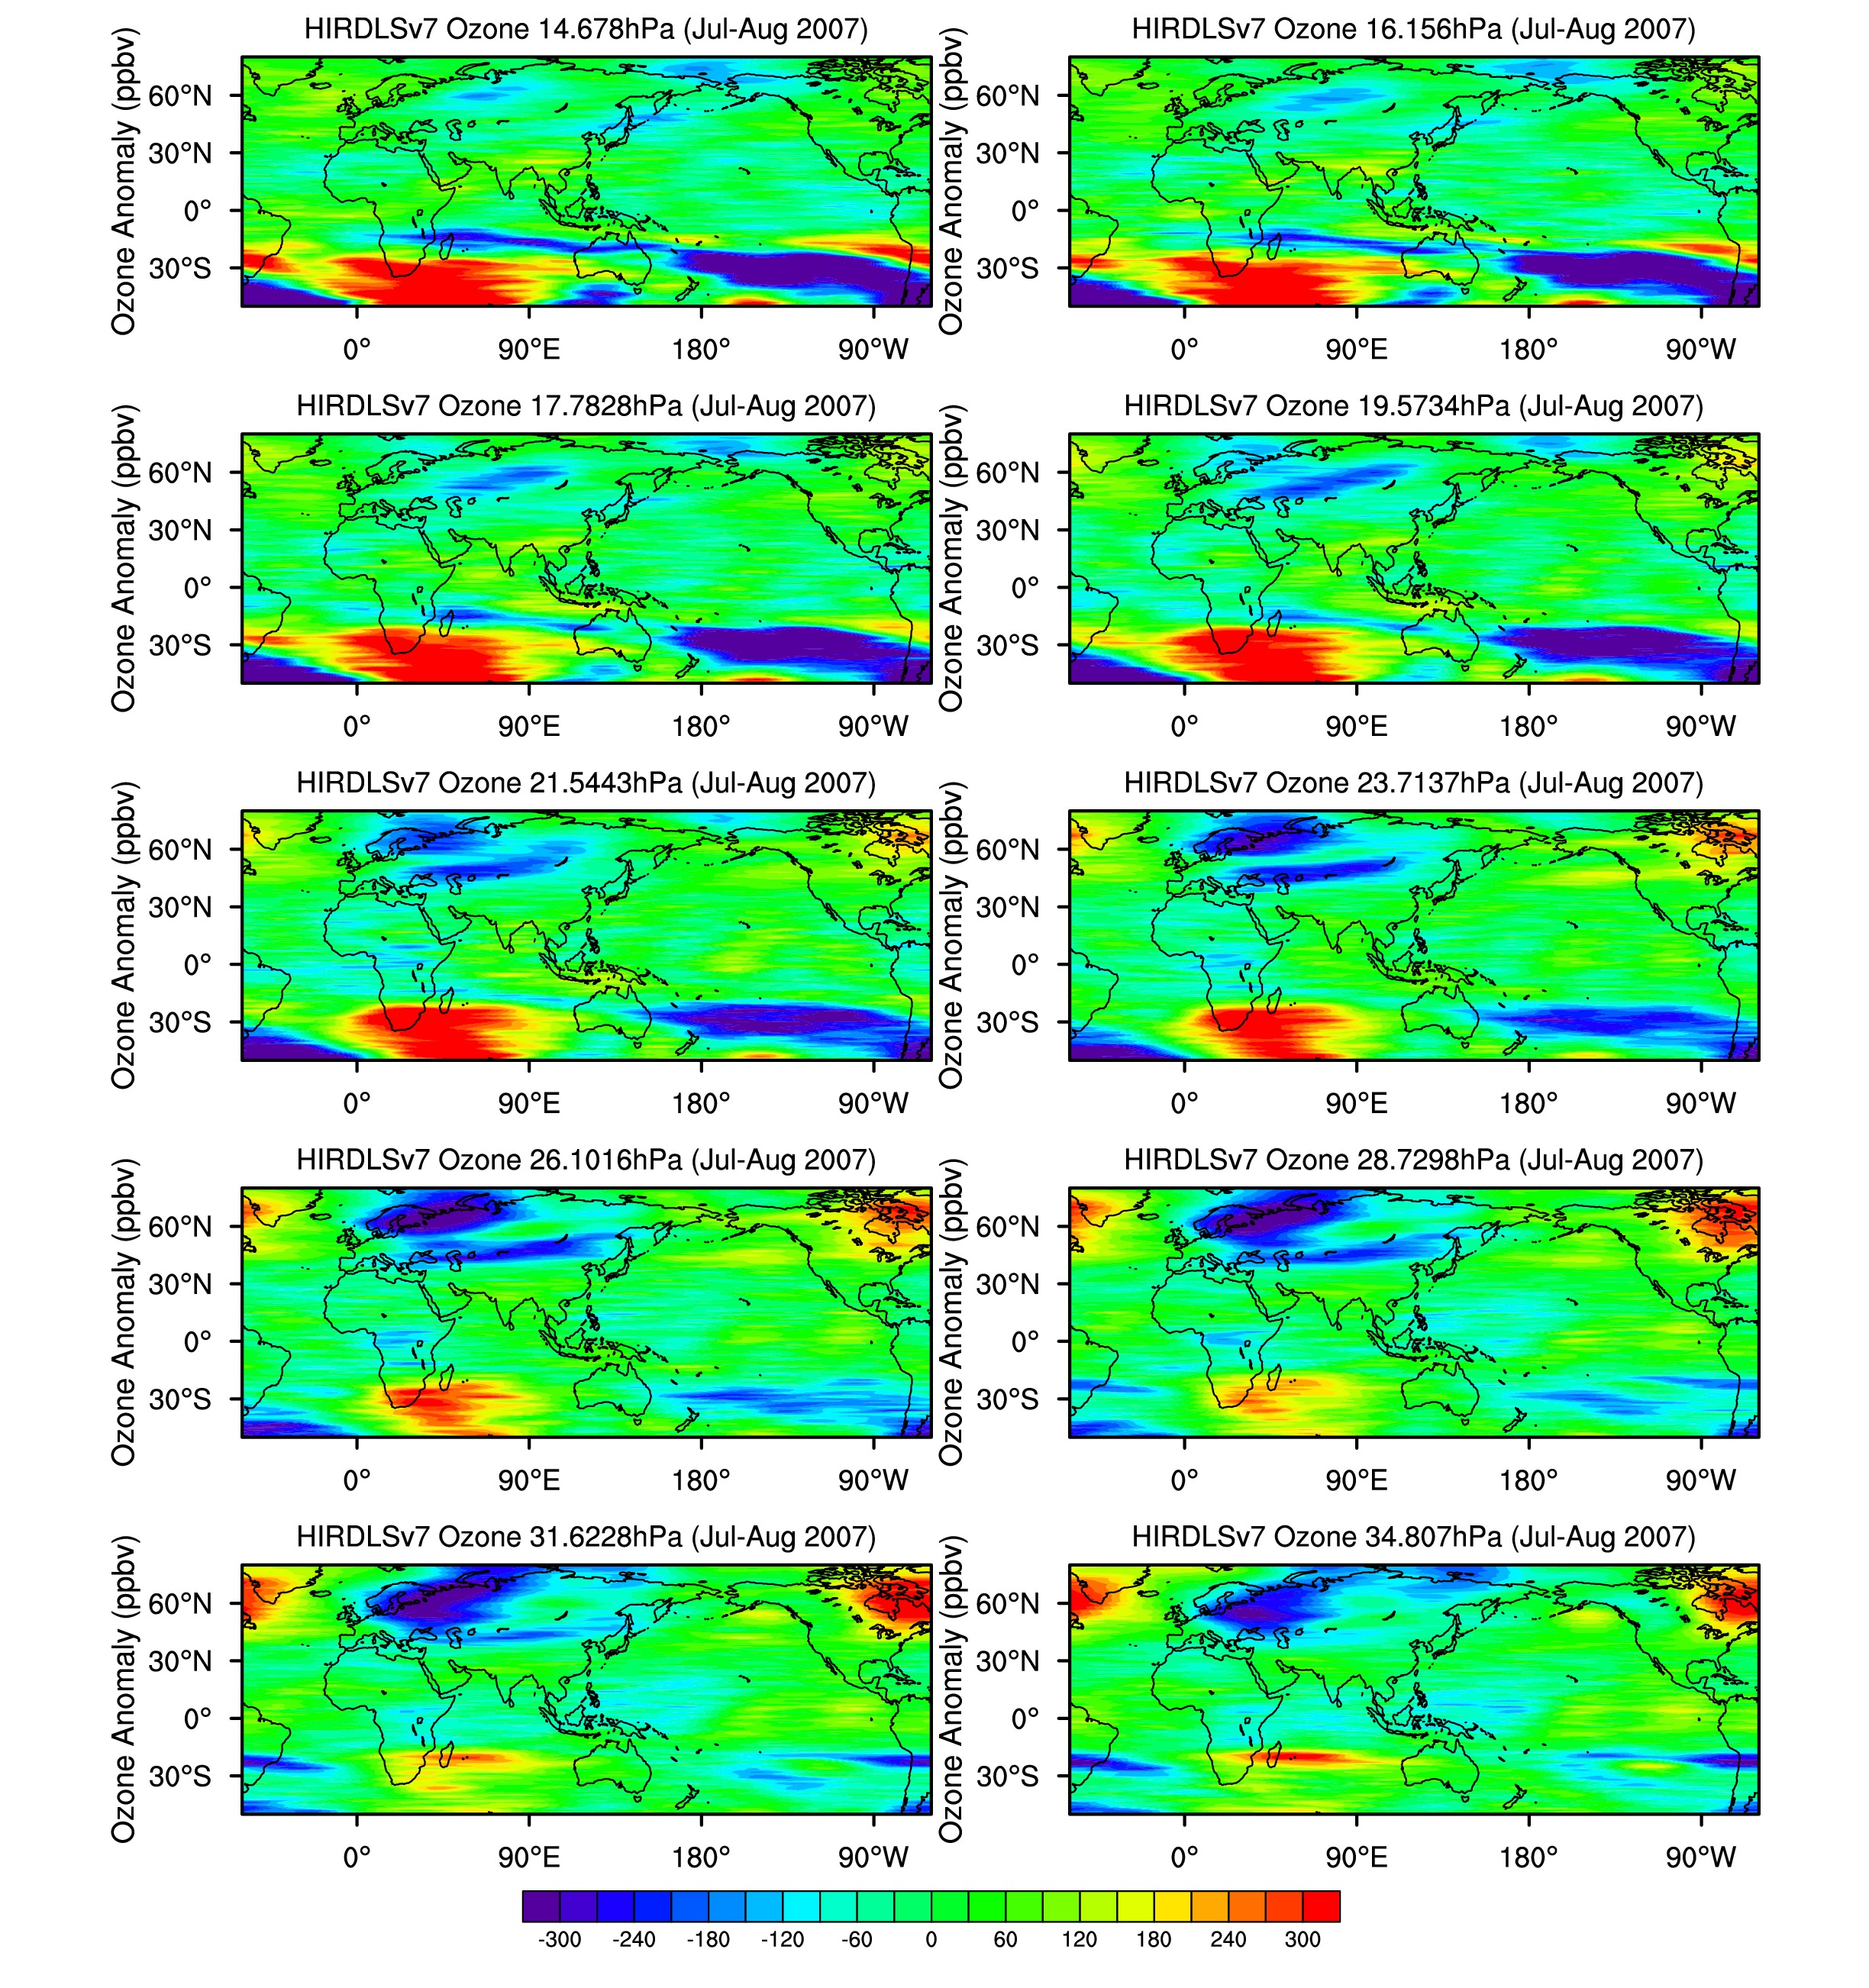
- Ozone: '05:
83-110mb, 38-91mb,15-35mb, '06: 83-110mb, 38-91mb, 15-35mb,'07: 83-110mb, 38-91mb, 15-35mb,
(22-133mb: '05,'06,'07)
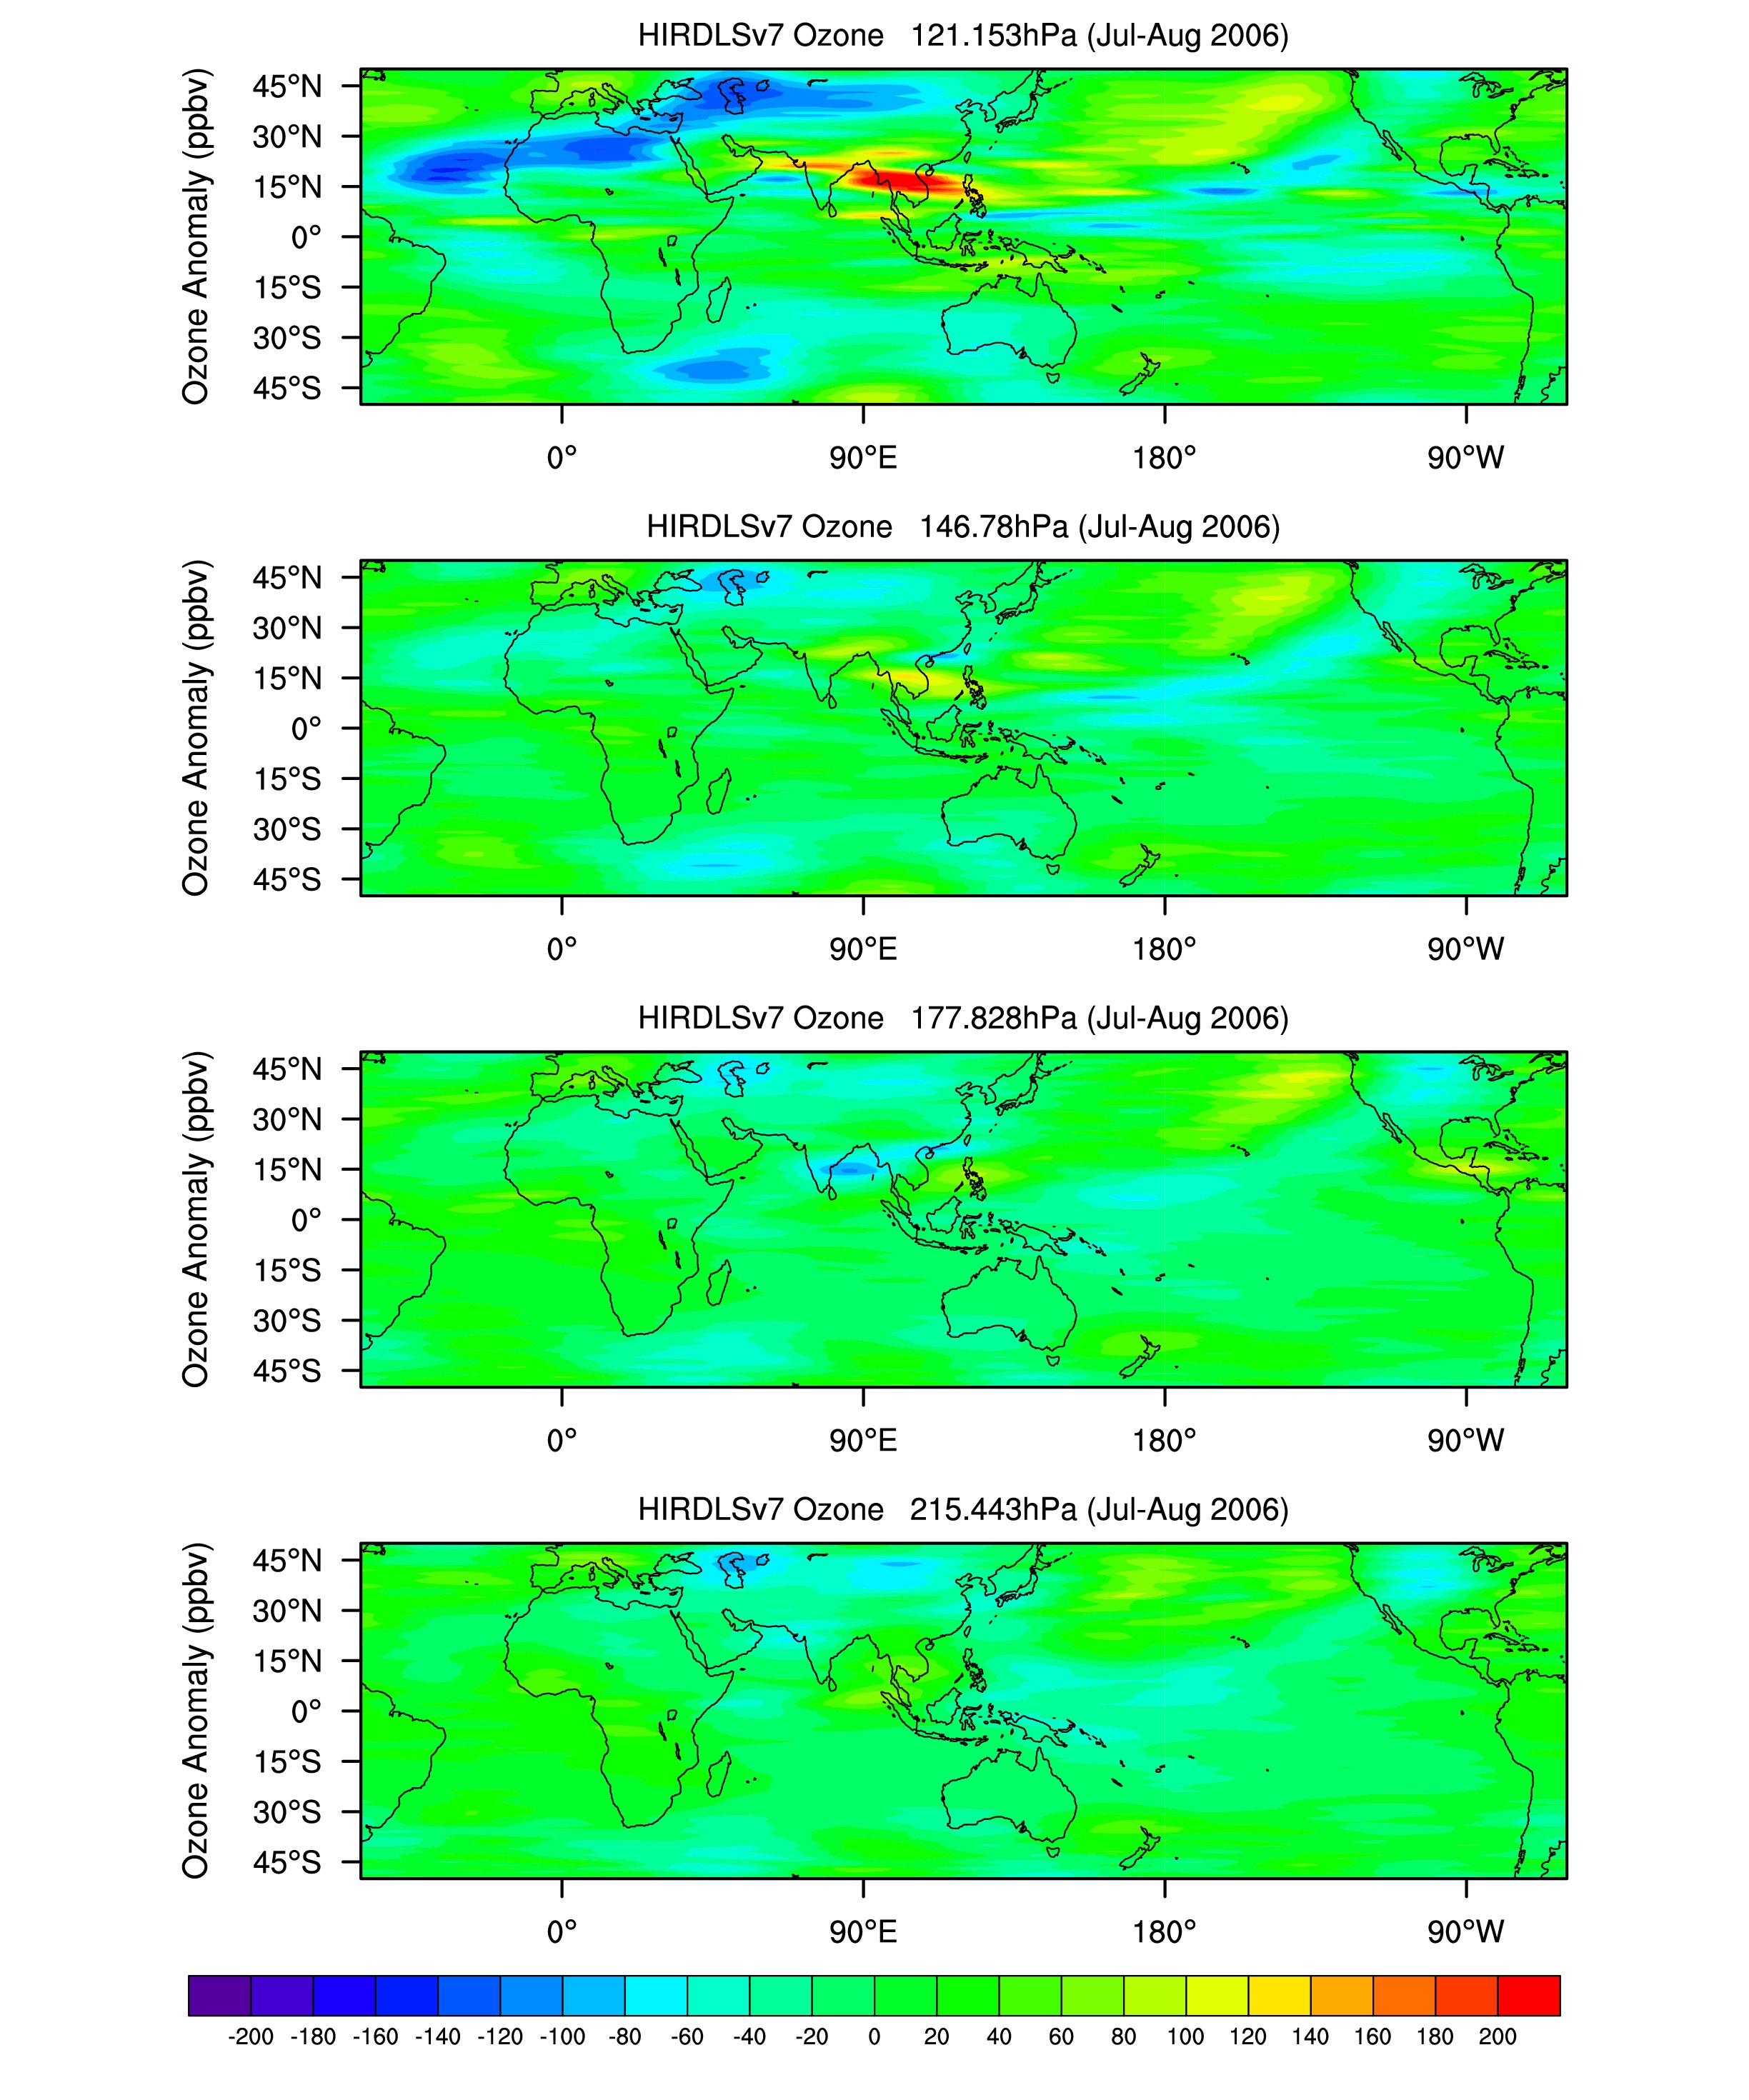
Ozone Anomalies: '05: 83-110mb,38-91mb,15-35mb,'06: 83-110mb,
[preliminary V7: 83-110mb, 42-74mb, 38-91mb, 15-35mb,
'07: 83-110mb, 38-91mb, 15-35mb,
121-215mb: '06]
- CFC11: 56-75mb:
'05, '06, '07,
26-162mb: '05,'06,'07,
CFC11 Anomalies: 56-75mb:'05, '06, [preliminary V7:'06],'07,
82-110mb:'06,42-74mb:'06
- CFC12: 56-75mb:
'05, '06, '07,
26-162mb: '05,'06,'07,
CFC12 Anomalies: 56-75mb:'05, '06, '07
82-110mb:'06,42-74mb:'06
- water: 68-91mb:
'05, '06, '07,water anomalies: 68-91:'05, '06, '07
- HNO3 anomalies: 61-82mb: '06
- NO2 anomalies: 61-82mb: Ascending'06, Descending'06
- Cross-sections of HIRDLS V.6 (30-60E) and (60-120E) for July-August mean with tropopause:
- GPH: '05, '06, '07, GPH Anomalies: '05, '06, '07
- Temperature:
'05, '06, '07, Temperature Anomalies: '05, '06,[preliminary V7:'06], '07
- Ozone:
'05, '06, '07, Ozone Anomalies: '05, '06, '07
- CFC11:
'05, '06, '07, CFC11 Anomalies: '05, '06, '07
- CFC12:
'05, '06, '07, CFC12 Anomalies:'05, '06, '07
- Cross-sections of HIRDLS V.6 (30-60E) and (60-120E) for January-February mean with tropopause:
- GPH: '06, '07, GPH Anomalies: '06, '07
- Temperature:
'06, '07, Temperature Anomalies: '06, '07
- Ozone:
'06, '07, Ozone Anomalies: '06, '07
- CFC11:
'06, '07, CFC11 Anomalies: '06, '07
- CFC12:
'06, '07, CFC12 Anomalies: '06, '07
- Cross-sections of HIRDLS V.6 (150-180E) and (150-210E) for January-February mean with tropopause:
- GPH: '06, '07, GPH Anomalies: '06, '07
- Temperature:
'06, '07, Temperature Anomalies: '06, '07
- Ozone:
'06, '07, Ozone Anomalies: '06, '07
- CFC11:
'06, '07, CFC11 Anomalies: '06, '07
- CFC12:
'06, '07, CFC12 Anomalies: '06, '07
- Hovmoller diagrams of HIRDLS V.6 (15-30N), different levels, for May 1 -- September 30:
- GPH: '05, '06, '07, GPH Anomalies: '05, '06, '07
- Temperature:
'05, '06, '07, Temperature Anomalies: '05, '06 (56-177mb), '06 (68-110mb),'07
- Ozone:
'05, '06, '07, Ozone Anomalies: '05, '06 (56-177mb), '06 (68-110mb), '07
- CFC11:
'05, '06, '07, CFC11 Anomalies: '05, '06 (56-177mb), '06 (68-110mb), '07
- CFC12:
'05, '06, '07, CFC12 Anomalies: '05, '06 (56-177mb), '06 (68-110mb),'07
- water:
'05, '06, '07, water anomalies: '05, '06, '07
- Hovmoller diagrams of HIRDLS V.6 species anomalies (15-30N) for the entire mission:
- T Anomalies: 51mb,
61mb,
68mb,
74mb,
82mb.
- O3 Anomalies: 51mb,
61mb,
68mb,
74mb,
82mb.
- CFC11 Anomalies: 51mb,
61mb,
68mb,
74mb,
82mb.
- CFC12 Anomalies: 51mb,
61mb,
68mb,
74mb,
82mb.
- H2O Anomalies: 51mb,
61mb,
68mb,
74mb,
82mb.
- Hovmoller diagrams of HIRDLS V.6 @100mb for the entire mission:
- Temperature: 0-15 N,
15-
30 N, T Anomalies: 0-15 N,
15-
30 N
- Ozone: 0-15 N,
15-
30 N, Ozone Anomalies: 0-15 N,
15-
30 N
- CFC11: 0-15 N,
15-
30 N, CFC11 Anomalies: 0-15 N,
15-
30 N
- CFC12: 0-15 N,
15-
30 N, CFC12 Anomalies: 0-15 N,
15-
30 N
- water: 0-15 N,
15-
30 N, water Anomalies: 0-15 N,
15-
30 N
- Hovmoller diagrams of HIRDLS V.6 @150mb for the entire mission:
- Temperature: 0-15 N,
15-
30 N, T Anomalies: 0-15 N,
15-
30 N
- Ozone: 0-15 N,
15-
30 N, Ozone Anomalies: 0-15 N,
15-
30 N
- CFC11: 0-15 N,
15-
30 N, CFC11 Anomalies: 0-15 N,
15-
30 N
- CFC12: 0-15 N,
15-
30 N, CFC12 Anomalies: 0-15 N,
15-
30 N
- water: 0-15 N,
15-
30 N, water Anomalies: 0-15 N,
15-
30 N
- Hovmoller diagrams of HIRDLS V.6 @215mb for the entire mission:
- Temperature: 0-15 N,
15-
30 N, T Anomalies: 0-15 N,
15-
30 N
- Ozone: 0-15 N,
15-
30 N, Ozone Anomalies: 0-15 N,
15-
30 N
- CFC11: 0-15 N,
15-
30 N, CFC11 Anomalies: 0-15 N,
15-
30 N
- CFC12: 0-15 N,
15-
30 N, CFC12 Anomalies: 0-15 N,
15-
30 N
- water: 0-15 N,
15-
30 N, water Anomalies: 0-15 N,
15-
30 N
- Hovmoller diagrams of HIRDLS V.6 @316mb for the entire mission:
- Temperature: 0-15 N,
15-
30 N, T Anomalies: 0-15 N,
15-
30 N
- Ozone: 0-15 N,
15-
30 N, Ozone Anomalies: 0-15 N,
15-
30 N
- CFC11: 0-15 N,
15-
30 N, CFC11 Anomalies: 0-15 N,
15-
30 N
- CFC12: 0-15 N,
15-
30 N, CFC12 Anomalies: 0-15 N,
15-
30 N
- Hovmoller diagrams of HIRDLS V.6 monthly mean "Climatologies" 10-30N for the entire mission:
- Temperature: 61mb, 68mb, 74mb, 82mb, 90mb,
100mb,
133mb
- Ozone: 61mb, 68mb, 74mb, 82mb, 90mb,
100mb,
133mb
- CFC11: 46mb, 68mb, 74mb, 82mb, 90mb,
100mb
- CFC12: 46mb, 68mb, 74mb, 82mb, 90mb,
100mb
- water: 61mb, 68mb, 74mb, 82mb, 90mb,
100mb,
133mb
Height v. Time contour plots of global average HIRDLS V.6 data
January 21, 2005 -- March 17, 2008
HIRDLS V.6.5 sample vector wind plot for July-Aug 2006 @100mb: (gif), @82mb: (gif), @68mb: (gif)
Other dates, levels available upon request.
HIRDLS V.6.5 sample EP flux plot: 2006d359 (gif)
Other days available upon request.
HIRDLS V.6.5 sample zonal wind plot @ high N latitudes: winter 2006 (gif)
Other times, latitudes available upon request.
HIRDLS V.6.5 sample meridional wind plot @ high N latitudes: winter 2006 (gif)
Other times, latitudes available upon request.
HIRDLS V.6 monthly mean species in SPARC format:
HIRDLS V.6 Temperatures compared with ERA-Interim temperatures:
HIRDLS V.6 Temperatures compared with SABER kinetic temperatures:
HIRDLS V.6 Temperatures compared with MLS temperatures:
See also Old Plots
Lesley L. Smith Home Page
To the Atmospheric Chemistry Home Page